This economic indicator forecasting project began as an initiative to understand how well Metaculus performed in comparison with other prediction sources. This report analyzes six months of continuous economic indicator forecasts from five sources and compares them to Metaculus forecasts across the same time period. Overall, Metaculus performed on par with, or above, all but one other platform in this analysis.
As economic indicators can be used to help make trading decisions and predict future volatility in the stock market, Metaculus’s strong performance provides evidence of a possible competitive advantage in the ability to predict movements within financial markets, which suggests opportunities to create value in new ways.
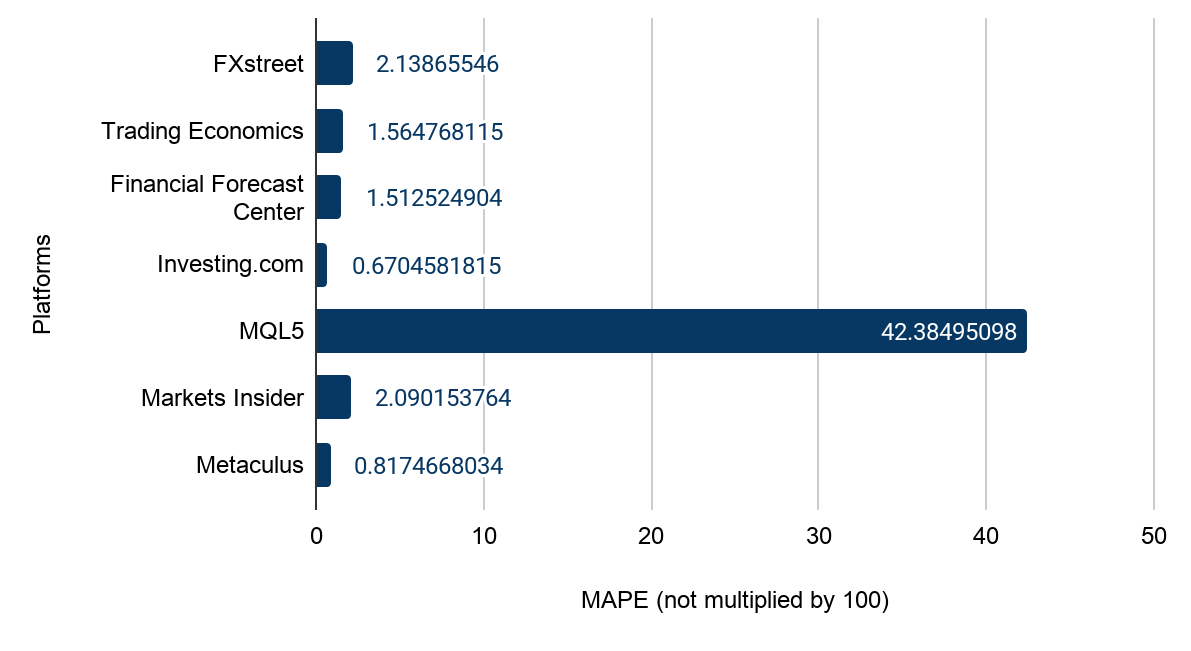
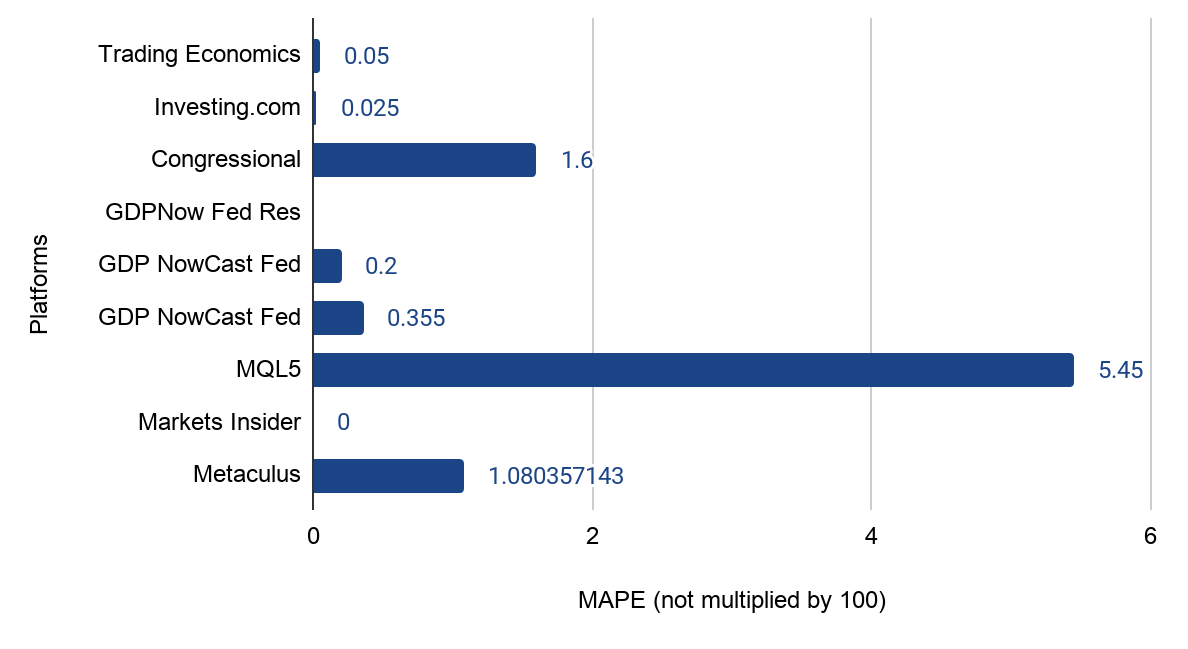
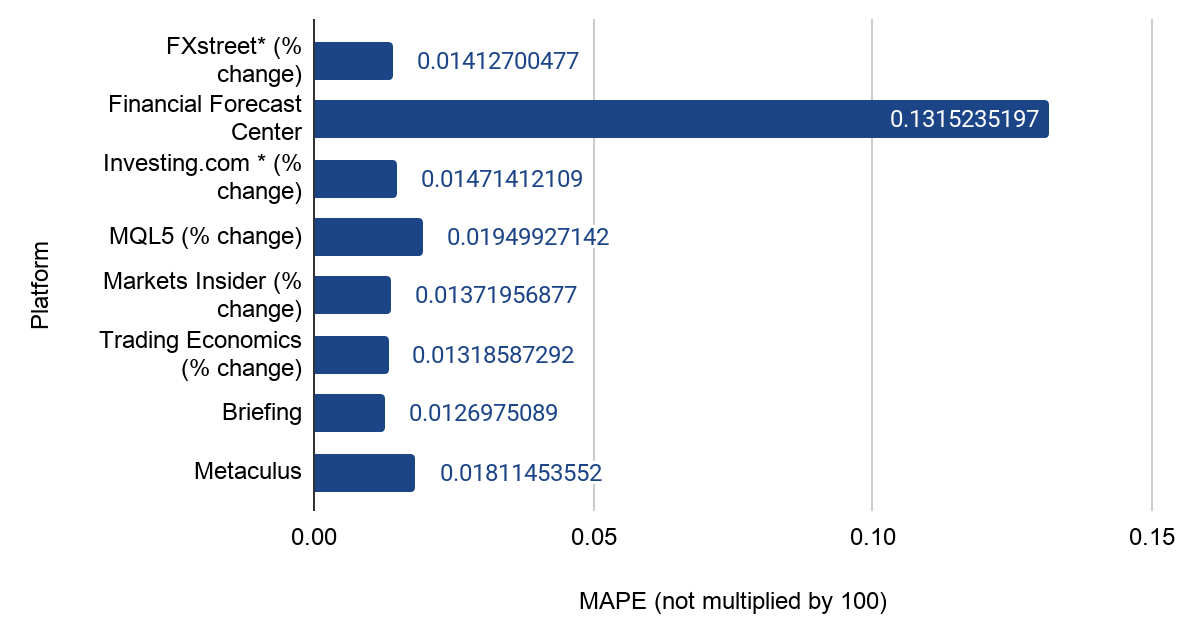
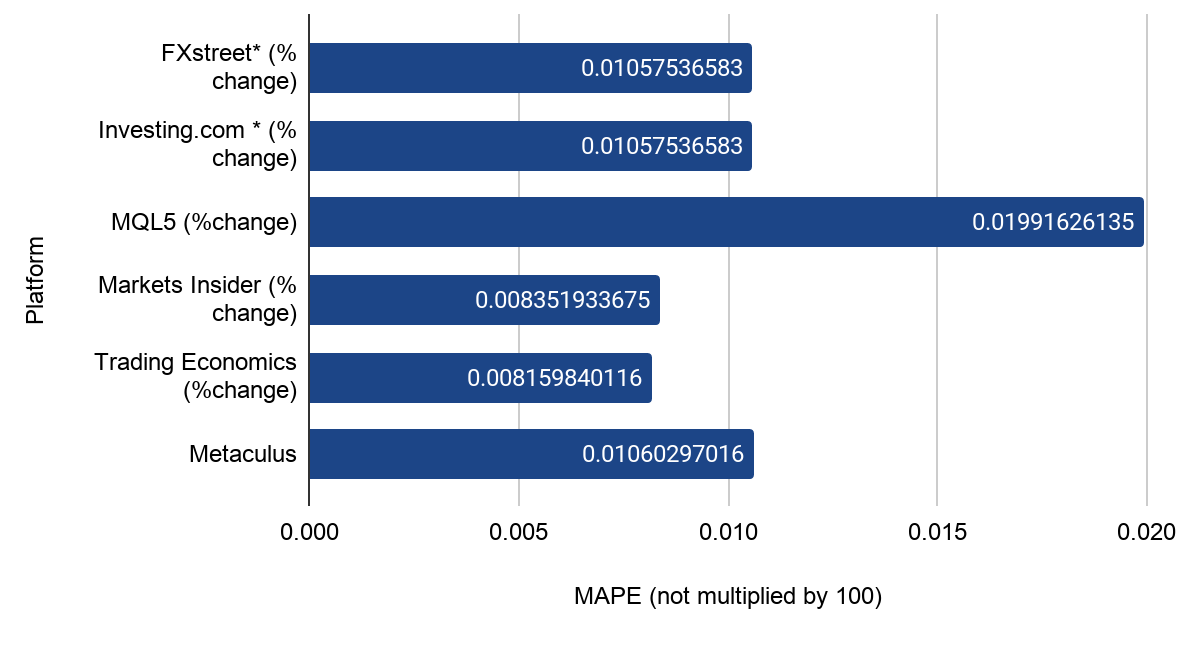
The below plots display forecasting performance as measured by Mean Absolute Percentage Error (MAPE), both by month and over the six months analyzed. For the month-to-month comparisons, Metaculus’s performance was contrasted with the average of all other platforms’ combined MAPEs. For the six-month comparisons, MAPEs were contrasted across platforms.


Metaculus’s Performance Compared With Other Platforms’
Metaculus’s overall performance across the six months as measured by MAPE was equivalent to or superior to all analyzed platforms, with the exception of Investing.com. Metaculus’s forecast errors during this period were lower than those ofthe Consensus Forecast provided by Consensus Economics, a firm specializing in surveys of expert economists on over 2000 macroeconomic indicators for 115 countries. (Note that several comparison platforms used these Consensus Forecasts in place of in-house forecasts for a subset of their indicators.)
When examining individual economic indicators, results varied: Metaculus had the second lowest error forecasting Non-Farm Payroll, placed in the middle of the group in Industrial Production Index, GDP, and Total Retail Sales, and tied for highest error on Initial Jobless Claims.

Time Is Of The Essence
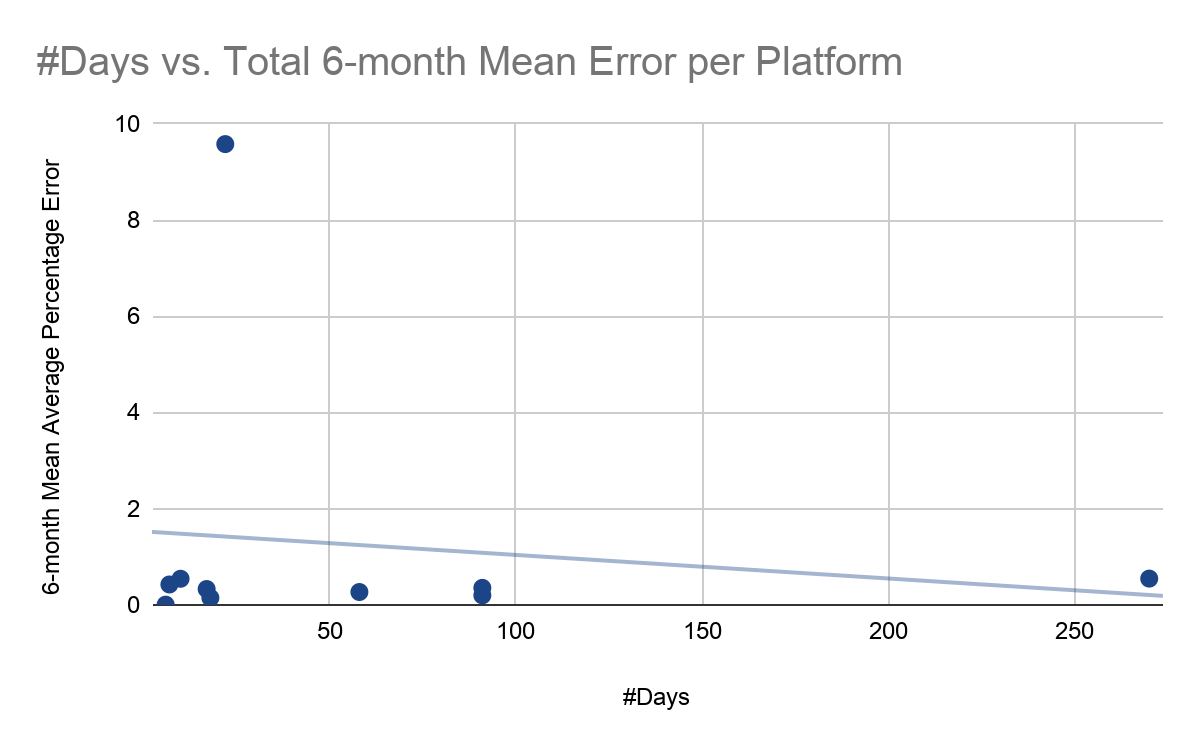
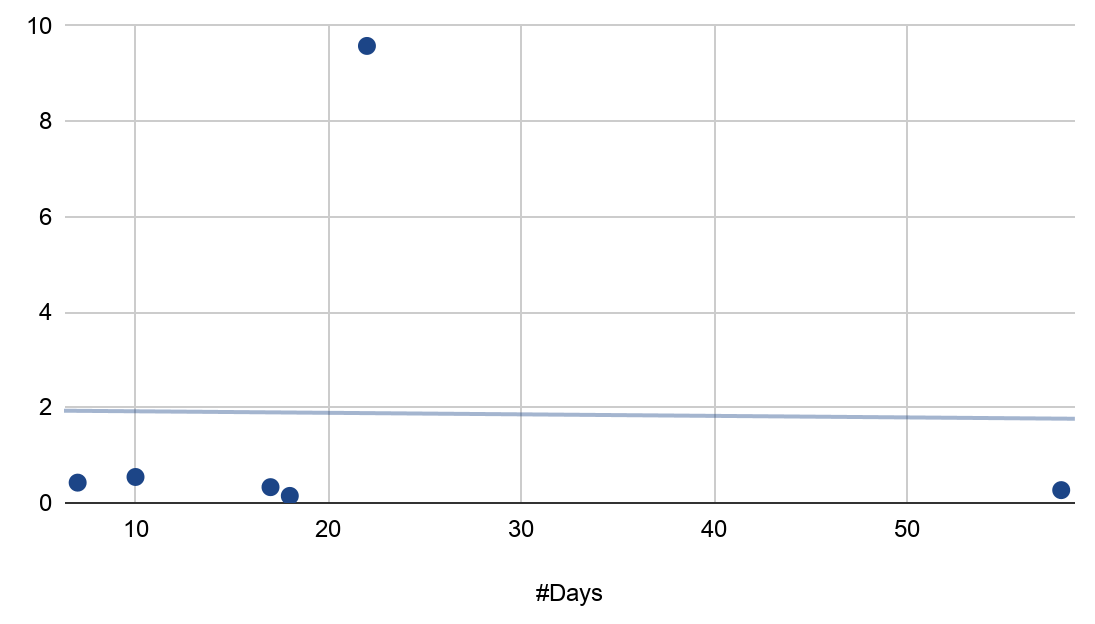
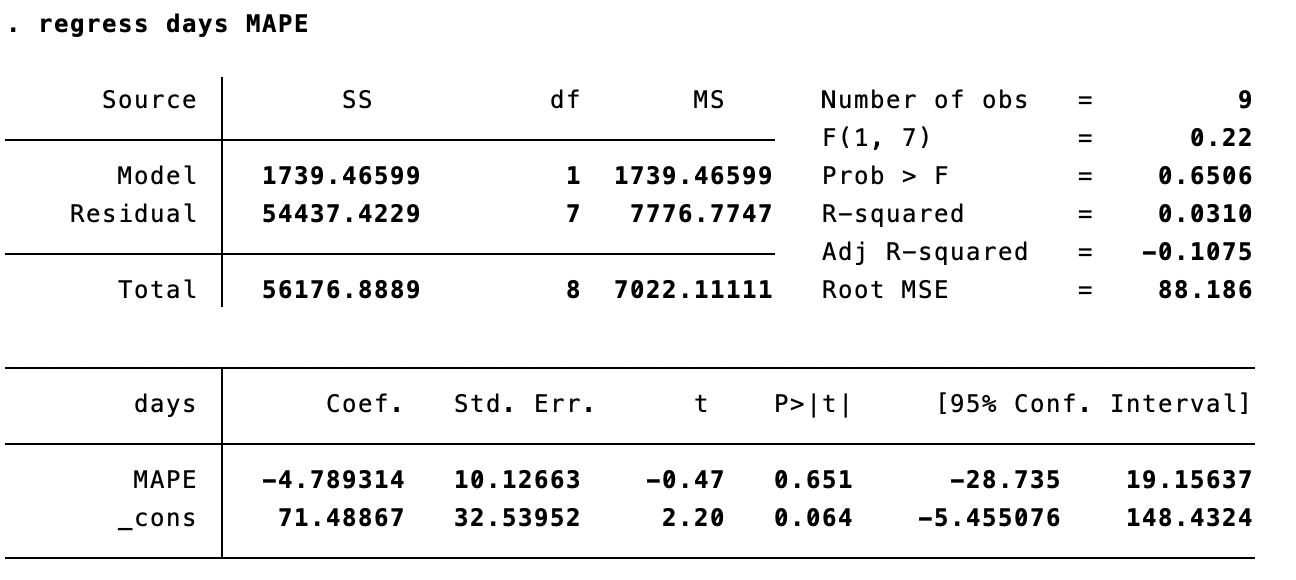
For a majority of the indicators, excluding GDP and Retail Sales, Metaculus provided forecasts an average of 36 days before competitors. A regression analysis did not reveal a statistically significant relationship between earlier forecasts and greater or less accuracy (Table 1). In sum, we found that Metaculus produces forecasts earlier than comparison sources, without a time-dependent decrease in accuracy.
Probability Distributions: Catching Hedge Cases
The probability distribution that accompanies each Metaculus question is one of the platform’s most powerful differentiators. Each question displays a full probability distribution with possible outcomes weighted according to Metaculus’s estimated likelihood of their occurrence.
Metaculus’s reliance on probabilistic as opposed to point forecasts aligns with what Tilmann Gneiting, in his 2014 paper “Probabilistic Forecasting” describes as a “paradigm shift” in forecasting, whereby there has been “a transdisciplinary transition from single-valued or point forecasts to distributional or probabilistic forecasts.”
Because other platforms do not provide probability distributions, and in order to allow for apples-to-apples comparisons with these other sources, Metaculus’s probabilistic forecasts were converted into point estimates at the distributions’ medians. As Gneiting goes on to say, “[F]orecasts should be probabilistic, i.e., they should take the form of probability distributions over future quantities or events… and they are an essential ingredient of optimal decision making.” We agree and believe that Metaculus’s approach, and the increased information density it provides, is on the whole a more appropriate choice for decision-makers seeking to quantify uncertainty and hedge against unlikely scenarios.
Next Steps: How To Tell The Metaculus Story Better
Metaculus performed equal to or better than most other platforms when evaluated across indicators over the six-month period analyzed. The next steps in this process will be to build a more extensive track record, to decrease error within and across indicators, and to bring new and more data into the analyses.
To continue building our forecast dataset on economic indicators, in April Metaculus will begin collecting forecasting data on three additional metrics: New Building Permits, Durable Goods Orders, and Michigan CSI Prelim.
To strengthen comparisons with other platforms, previously run questions on EIA Crude Oil Stock and CPI-U will have resolution criteria updated to allow for more informative analyses.
User engagement on the economic indicator questions is robust, with approximately 5,500 predictions across all indicator questions. Engagement with these question sets is key for the accuracy of the forecasts and to the usefulness of the data gathered, and we thank all the forecasters who have participated, provided feedback, and encouraged the continuation of this series. We expect to release further analyses this summer, and welcome your comments.