# Main Takeaways
* **Relative forecast performance on near-term questions is a modest predictor for far-term questions:** There is a significant, strong correlation between relative performance (rank based) on near termed and far termed questions.
* **Both the old and new Minibench designs show a statistically significant signal for predicting performance on far-term questions:** a direct, head-to-head test still does not find a statistical difference between the two Minibenches' performance on predicting long term performance.
# Introduction
One of the basic principles of forecasting is that the accuracy of a well-calibrated forecast will decrease as the time window increases between a forecast and its respective event. As the time delta increases, so does the opportunity for noise, generally resulting in a regression towards a base case. For a trivial example, given a competition between two similarly postured teams that is yet to start, you may predict a 50:50 chance of winning for respective teams A:B, but if the game is near completion and one team has a significant lead over the other, the predictions will eventually converge to either 100:0 or 0:100 in favor of whatever team has a lead. Once again, assuming a well-calibrated forecaster, the accuracy of the later predictions will be higher (i.e., the prediction is closer to the resolution).
This analysis is not seeking to analyze the fundamental principle that accuracy improves or decreases according to time. Rather, the intent is to discern whether forecasters (specifically, Metaculus' forecasting bots) may have specific competitive advantages for near-term or far-term questions, measured by baseline score. Simply: we want to know how well being good at short-term forecasts predicts being good at long-term forecasts. This analysis additionally focuses heavily on whether there is a major difference between new and old Minibench (a tournament for forecasting bots that has questions that resolve within 2 weeks) questions in term of their far-term performance predicting power.
# Data Selection
This analysis uses data for binary, multiple-choice, and numeric questions from Metaculus bot forecasters only. An earlier iteration of this analysis used only binary questions, but the smaller sample size was insufficient to produce any meaningful output, particularly in the Minibench-specific comparisons where the number of eligible forecasters and questions was already limited. This was addressed by scoring the same bot forecasters' multiple-choice and numeric questions as well, taking the dataset from roughly 124,000 to roughly 212,000 scored forecasts (about a 70% increase). This does introduce a minor concern, as the [baseline score](https://www.metaculus.com/help/scores-faq/#baseline-score) of two question types can not be assumed to be perfectly comparable, and different buckets within the analysis have different ratios of each question type. This is a compromise that this analysis makes for simplicity and to create a large enough dataset. We believe this would be a negligible Since Metaculus calculates baseline accuracy on an aggregate of question types, this provides further justification for this approach.
# Analysis
First, to preview how baseline performance varies across time windows, all forecasts were split into time windows of (0, 7], (7, 14], (14, 30], (30, 120], and (120, 365] days between forecasting submission and resolution, and each forecast's baseline score was calculated. From there, a 95% CI bootstrap was constructed for the mean baseline score of each (forecaster, time window) pairing. The following chart was generated using the top 15 forecasters by volume in order to get quality bootstrapped intervals.
**Note:** This chart, and every correlation test in the sections below, requires a forecaster to have a minimum number of questions forecasted on in each time window being compared in order to get a reliable bootstrap; this restricts the analysis to established, higher-volume bots, and the results below may not generalize to newer or lower-volume forecasters.
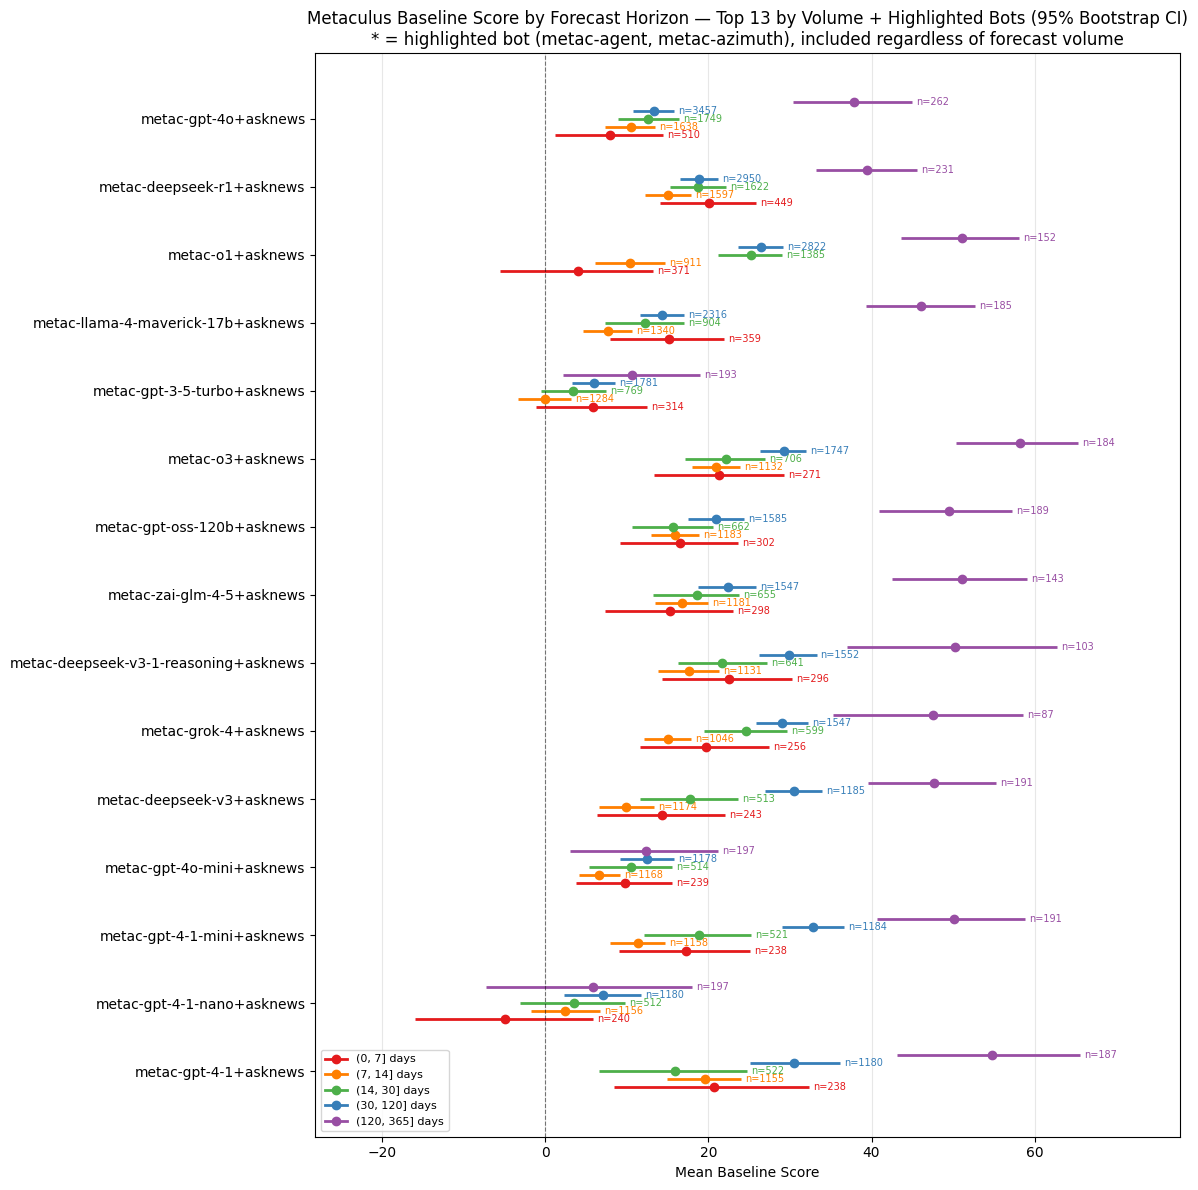
It appears that there is a general pattern that bots tend to generally perform better on far-term questions. Additionally, we can already hypothesize that the near-term performance is only a modest predictor for far-term performance. A perfect correlation for two time windows would imply that for every pair of forecasters, the better performing bot would perform better on in both time windows being compared. The following section goes into greater detail of how this correlation score is calculated.
## Spearman's Rank Correlation
To run this analysis, we are leveraging [Spearman's rank correlation](https://en.wikipedia.org/wiki/Spearman%27s_rank_correlation_coefficient), which calculates a correlation value $\rho = 1 - \frac{6\sum^{N}_{n=1}(R_0[F_n] - R_1[F_n])^2}{N(N^2 - 1)}$ where $N$ is the number of forecasters, $R_x[F_n]$ is the rank of forecaster $F_n$ in a leader-board $x$. A correlation value $\rho$ of 1 indicated perfect correlation (someone who places nth place in leader-board 1 also places nth place in leader-board 2), a value of -1 indicated perfect negative correlation (someone who places nth place in leader-board 1 places (N-n)th place in leader-board 2), and a value of 0 indicates that placement between the two leader-board is completely unrelated.
Since we are mainly concerned about competitive advantages, and since this metric doesn't depend on any statistical relationship between the forecasters, this works as a simple and effective metric to determine how well near and far term forecast performance correlate.
One challenge is that "short term" and "long term" are not well defined. For this project, the line is drawn somewhat arbitrarily at 2 weeks. This is due to 2 weeks being the time period that Minibench forecasts fall within, which aids in a couple goals: providing more usable data, and permitting investigation of whether the newer LLM-generated Minibench questions provide better signal for measuring forecast performance,
**Note:** For all statistical tests, the standard p-value threshold of 0.05 is being used for statistical significance. Since multiple p-values are being calculated on the same dataset, the [Benjamini–Hochberg correction](https://en.wikipedia.org/wiki/False_discovery_rate#Benjamini%E2%80%93Hochberg_procedure) is additionally being used, although the correction appears to have no effect on the outcomes in this circumstance.
### Correlation Comparison
The two main foci of this project are 1) determinng if near term performance correlates well with far term performance; and 2) determining if there is a correlation difference between the the newer LLM generated Minibench questions vs the older automated Minibench questions in terms of this correlation. Both these questions are addressed here.
There are two visuals here to explore the correlations of our decided bins: a correlation matrix and a box plot. The buckets used for comparison are as follows:
* Non-Minibench forecasts in the (0, 14] day time window.
* Old Minibench forecasts.
* New Minibench forecasts.
* Non-Minibench forecasts in the (14, 365] day time window.
Minibench questions are all in the (0, 14] day time window.
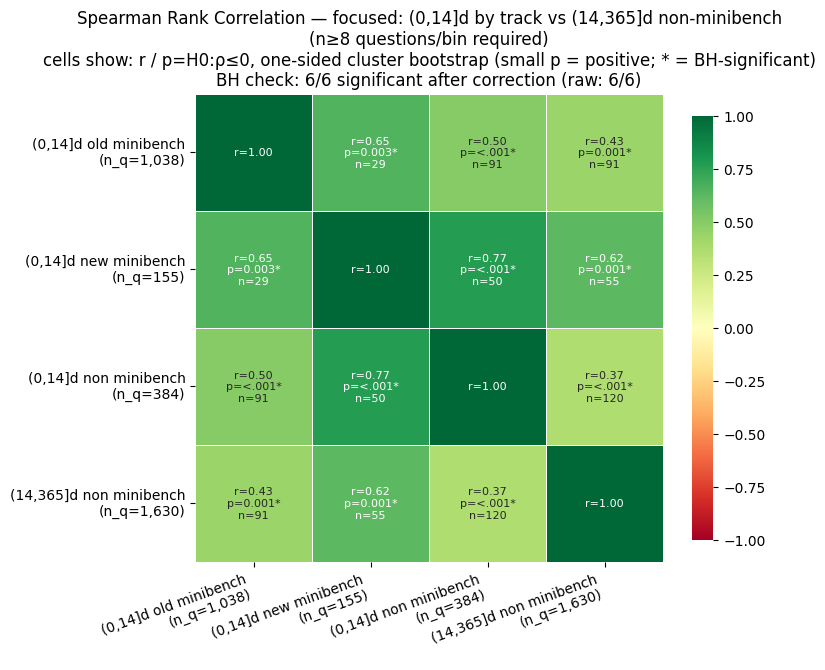
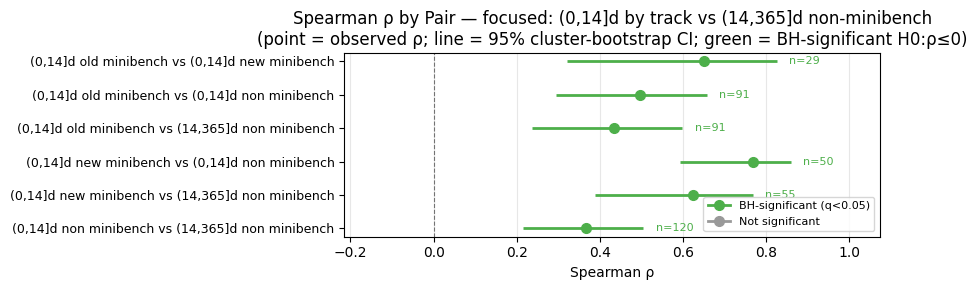
All comparisons show a correlation that is statistically significantly greater than 0. Interestingly, the weakest entry appears to be the comparing the near-term and far-term resolutions within the non-Minibench questions.
The other five comparisons in this matrix should be treated with an asterisk: three (old Minibench vs. non-Minibench, new Minibench vs. non-Minibench, and old vs. new Minibench) hold the time window fixed at (0, 14] but still mix in a shift in question format, and two (old Minibench vs. far-term non-Minibench, new Minibench vs. far-term non-Minibench) mix both a shift in time horizon and a shift in question format at once. This design can't cleanly separate which of these is driving any individual correlation, which is worth keeping in mind when weighing the Minibench-specific numbers against the one clean comparison of questions within the same tournament type.
### Pairwise Comparison
The following table tests, for each near-term forecasting bucket, whether one's near-to-far-term correlation exceeds the other's (one-sided, H0: ρ\_row ≤ ρ\_col). Entries mirroring across the diagonal will sum to 1.
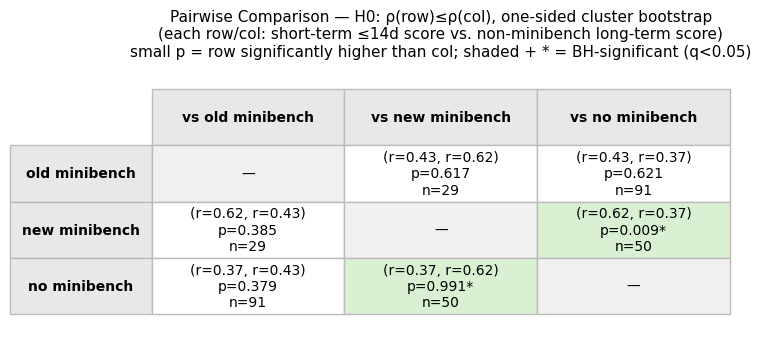
One of the three pairwise comparisons reach significance: we can say that the new Minibench is a (statistically) significantly better predictor of far-term performance than the non-Minibench questions. This is interesting for the same reason prior noted: a Minibench predicts performance outside itself better than non-Minibench questions predict their own performance. 
# Conclusions
Near-term forecasting performance is a statistically significant, if modest, predictor of far-term performance. Further exploration that falls outside of the specific scope of this article, which tested more fine-grained time buckets, also hinted that the correlation tended to be decrease as the time window expanded, but the correlation was still statistically significant. Pairwise comparisons between the correlation scores were not made in this investigation, so this is not so much of a reportable finding as it is an intuition that appears to have some cursory support.
One of the major questions this analysis set out to answer, whether the redesigned, LLM-generated Minibench carries a stronger long-term signal than the original automated Minibench, is not resolved by this data. Both designs individually show a statistically significant correlation with far-term performance, but a direct head-to-head test does not find a significant difference between them. There appears to be a leaning towards the new Minibench performing better in this respect, and it is fully plausible that with a greater dataset, that lean could amplify into significance, but this conclusion is yet unsupported.