*Want to skip straight to our new Radiant map on where AI IPO dollars will flow?* [<u>*Head over here*</u>](https://radiant.metaculus.com/projects/e80a5e79-b71f-4c4b-bf4a-821497fedcee)*.*
The Anthropic and OpenAI IPOs could put tens of billions of dollars into philanthropy. In our[ <u>previous map</u>](https://www.metaculus.com/notebooks/45870/mapping-the-ai-ipo-windfall/), forecasters estimated how much will reach charities by the end of 2031, roughly five years after the IPOs.
Our **Anthropic + OpenAI IPO cause area** map asks: Where exactly will that money *go*? There are two funding pools to consider:
The first is what Anthropic and OpenAI founders and employees give to charities from their equity, how much stays parked in donor-advised funds and private foundations, and how the rest is divvied up across different charitable causes, like AI safety, animal welfare, biosecurity, climate change, and global health.
The second is the OpenAI Foundation's own grantmaking, split between AI for medicine and its jobs and community programs. (The map does *not* include early outside investors like Dustin Moskovitz and Jaan Tallinn, or the big corporate stakeholders.)
## **Forecasting the cause-area split**
Here's where [<u>the map</u>](https://radiant.metaculus.com/projects/e80a5e79-b71f-4c4b-bf4a-821497fedcee) lands as of publication:
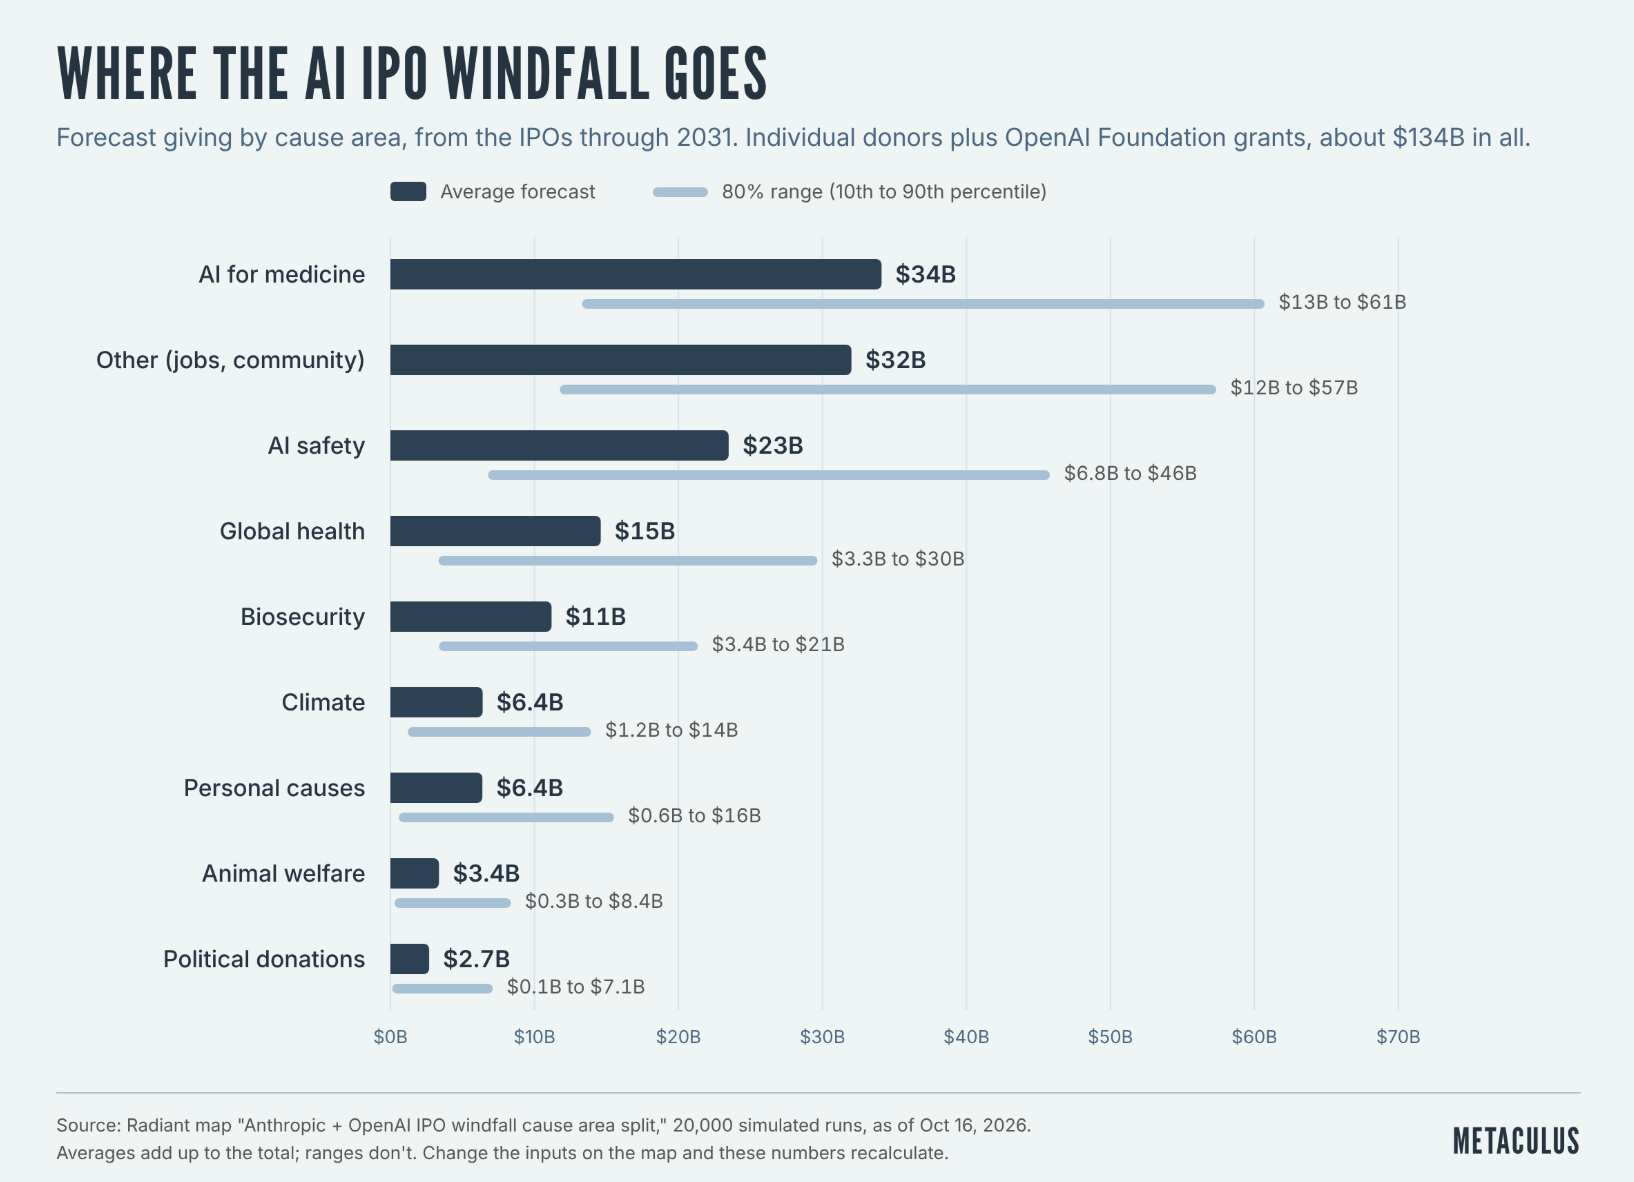
The forecast ranges are wide right now, with between \$13B and \$61B going toward ‘AI for medicine’ and between \$6.8B and \$46B to ‘AI safety’ — and all highly contingent on how much money the IPOs make available. (For more on that initial number and where it comes from, see our [<u>IPO Windfall series</u>](https://metaculus.substack.com/p/ai-ipo-windfall-prediction-forecast-radiant-visual-mapping) and [<u>our prior map</u>](https://radiant.metaculus.com/projects/1c3f7d1a-8ad9-4d6f-a906-90de0ec06f88).)
### **Where will philanthropic dollars land, and why**
This map is our prediction of where the money will go, but these aren’t forecasts we can really resolve. There’s no data source that will tell us in the end what share of the windfall went toward climate efforts, to biosecurity risk, or to global health.
But mapping the flow of philanthropic dollars, and making explicit the relationships between forecasts and the assumptions behind them, helps us get a foothold in this new landscape. It also makes it easier to see where perspectives diverge and why.
### **The light orange nodes: our forecasts**
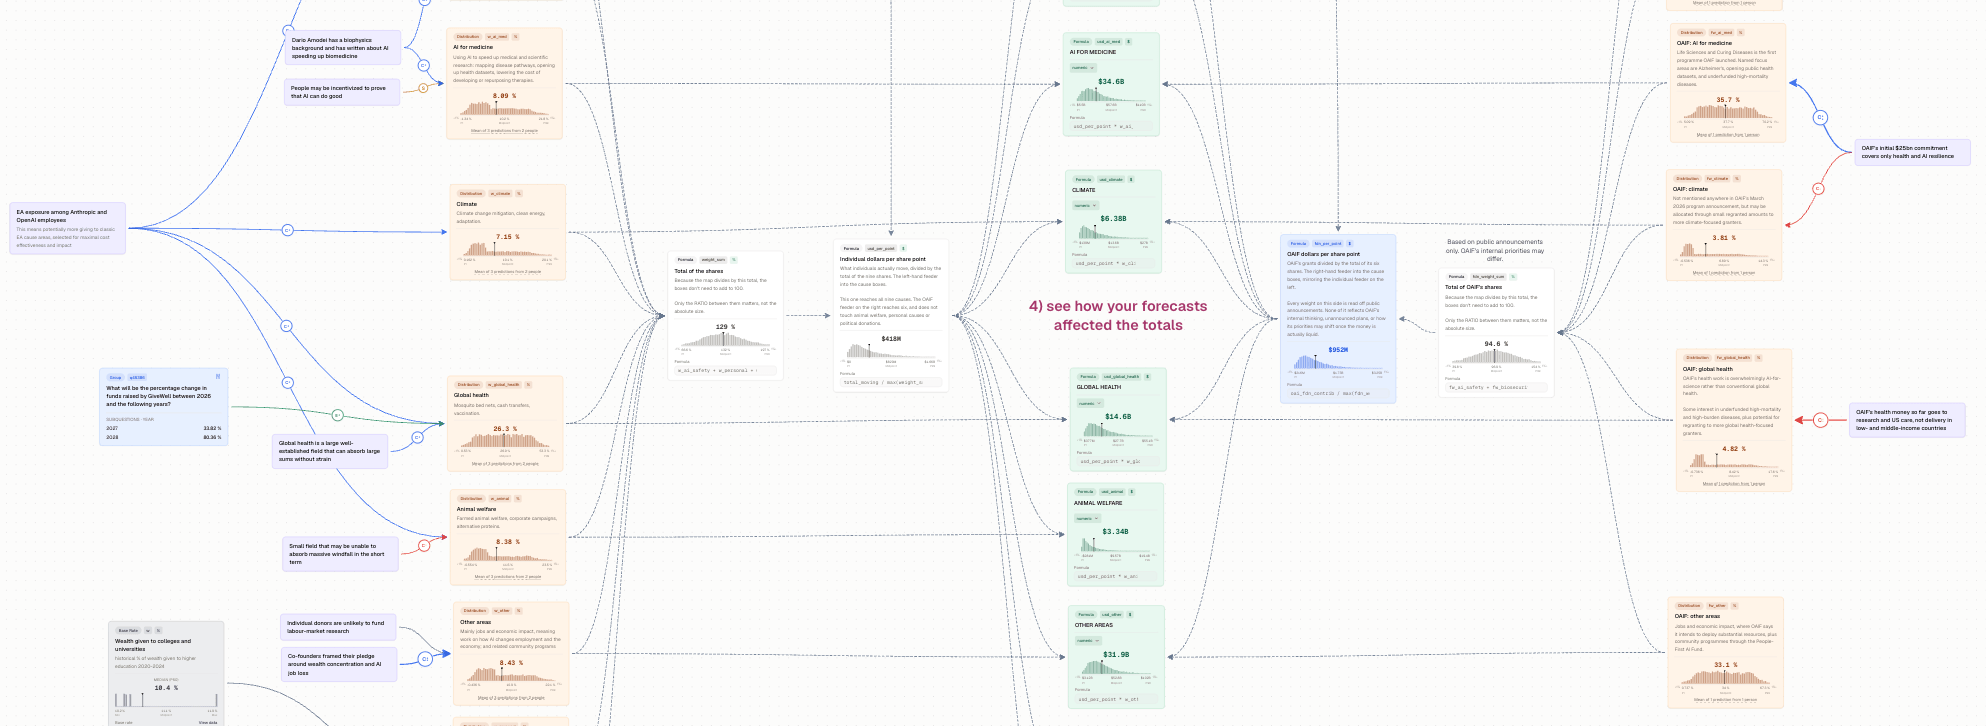
Each light orange node is a forecast of the share of the windfall that ends up in one cause area, like AI safety, global health, or personal causes. At publication, each one shows the aggregate of several Metaculus team members’ forecasts, alongside forecasts from[ <u>Autocast</u>](https://www.metaculus.com/notebooks/46097/autocast-early-access/).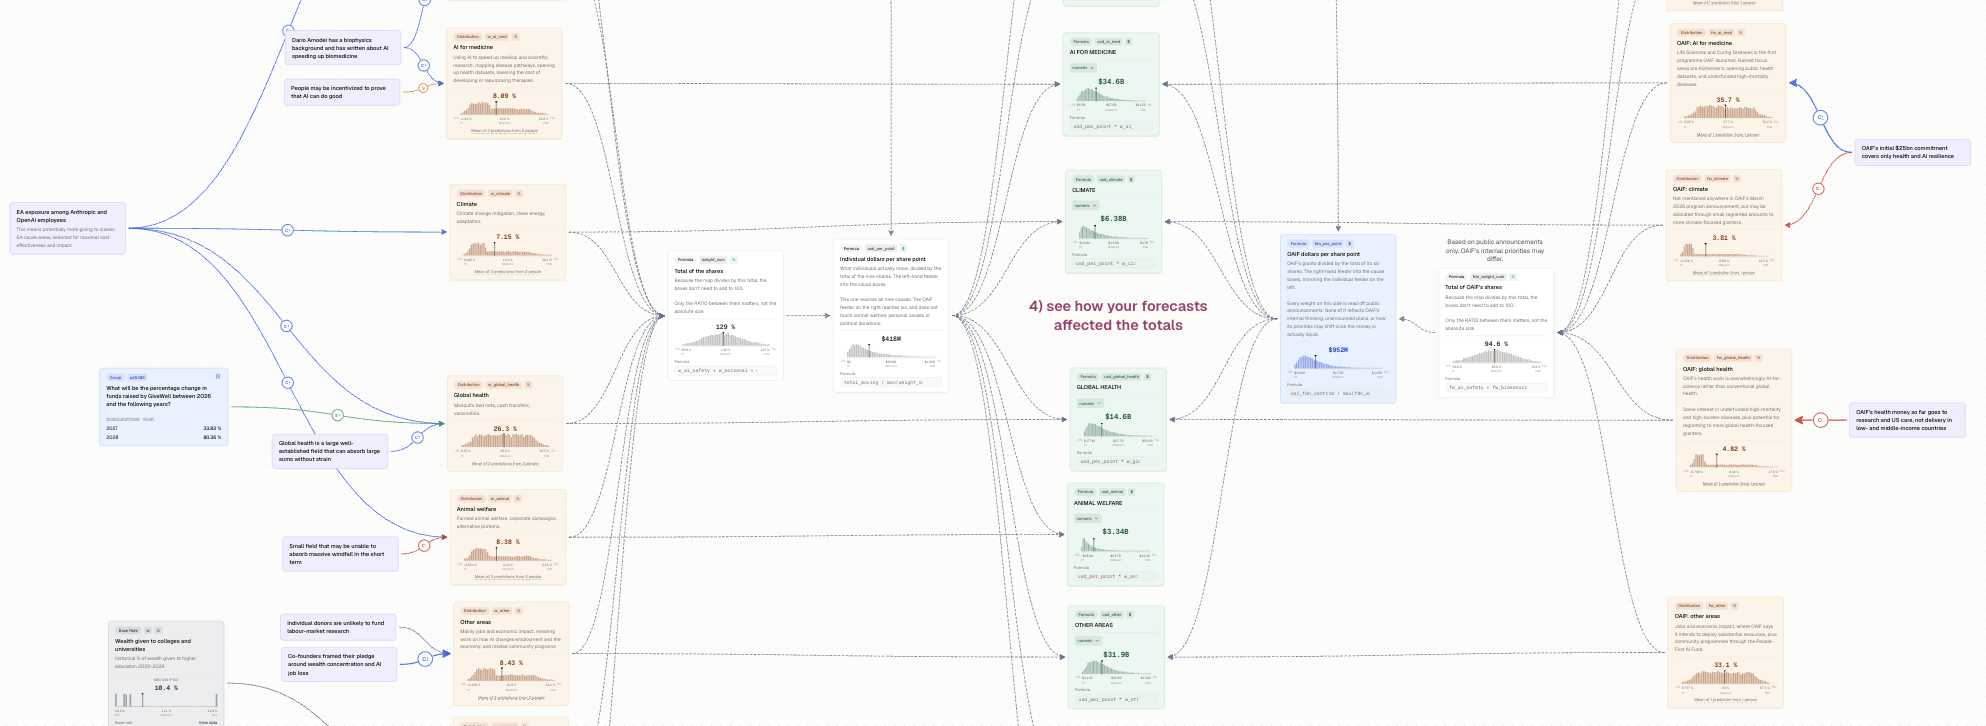
*Note: It's the medians of the aggregate forecast distributions that we're highlighting on the nodes. These medians are not meant to cleanly combine to 100%.*
### **What underlies the maps**
The map draws on three kinds of evidence:
**Base rates** (grey nodes). Historically, about a quarter of US charitable giving goes to religious institutions and around a tenth goes to colleges and universities. That's a big reason personal causes rank second. And then the median amount of tech-sector political spending has been \$355M per election cycle from 2016 to 2024. It’s also up 135% over the last decade.
<img height="339" width="638" src="https://cdn.metaculus.com/user_uploaded/Screenshot_2026-10-16_at_4.39.44PM.png" />
**Live Metaculus questions** (blue nodes). These are resolvable proxies that provide some guidance on the ultimate distributions. Forecasters expect Coefficient Giving to put about[ <u>44% of its grantmaking toward AI safety</u>](https://www.metaculus.com/questions/45375/) in 2027, and to[ <u>increase its total grantmaking</u>](https://www.metaculus.com/questions/45374/) by 71%. They also expect[ <u>GiveWell's fundraising</u>](https://www.metaculus.com/questions/45386/) to grow 34% and[ <u>METR's received contributions</u>](https://www.metaculus.com/questions/45385/) to grow 49% over the same period. You can see reasoning from our Pro Forecasters in the comments under these questions.
<img height="322" width="449" src="https://cdn.metaculus.com/user_uploaded/Screenshot_2026-10-16_at_4.40.09PM.png" />**Reasoning notes** (purple nodes). These provide important context for the map, with lines connecting them to the orange forecast nodes to clarify the kind of relationship (a direct cause, supporting evidence, a push up or a push down). Anthropic and OpenAI employees are (naturally) more exposed to AI safety concerns than most new donors. But AI safety is a small field and may not be able to absorb a flood of money, while global health can take large sums without strain. People who are newly rich in a heavily regulated industry may also be more incentivized to fund political candidates.
## **How to weigh in**
If you think we’ve overrated AI safety, or underrated how much will go to someone’s alma mater, there are a few ways to put your own numbers on this.
Forecast on the questions in the [AI Lab IPOs series](https://www.metaculus.com/tournament/ai-lab-ipo/). Those are resolvable Metaculus questions, and your forecasts go straight into the community predictions there.
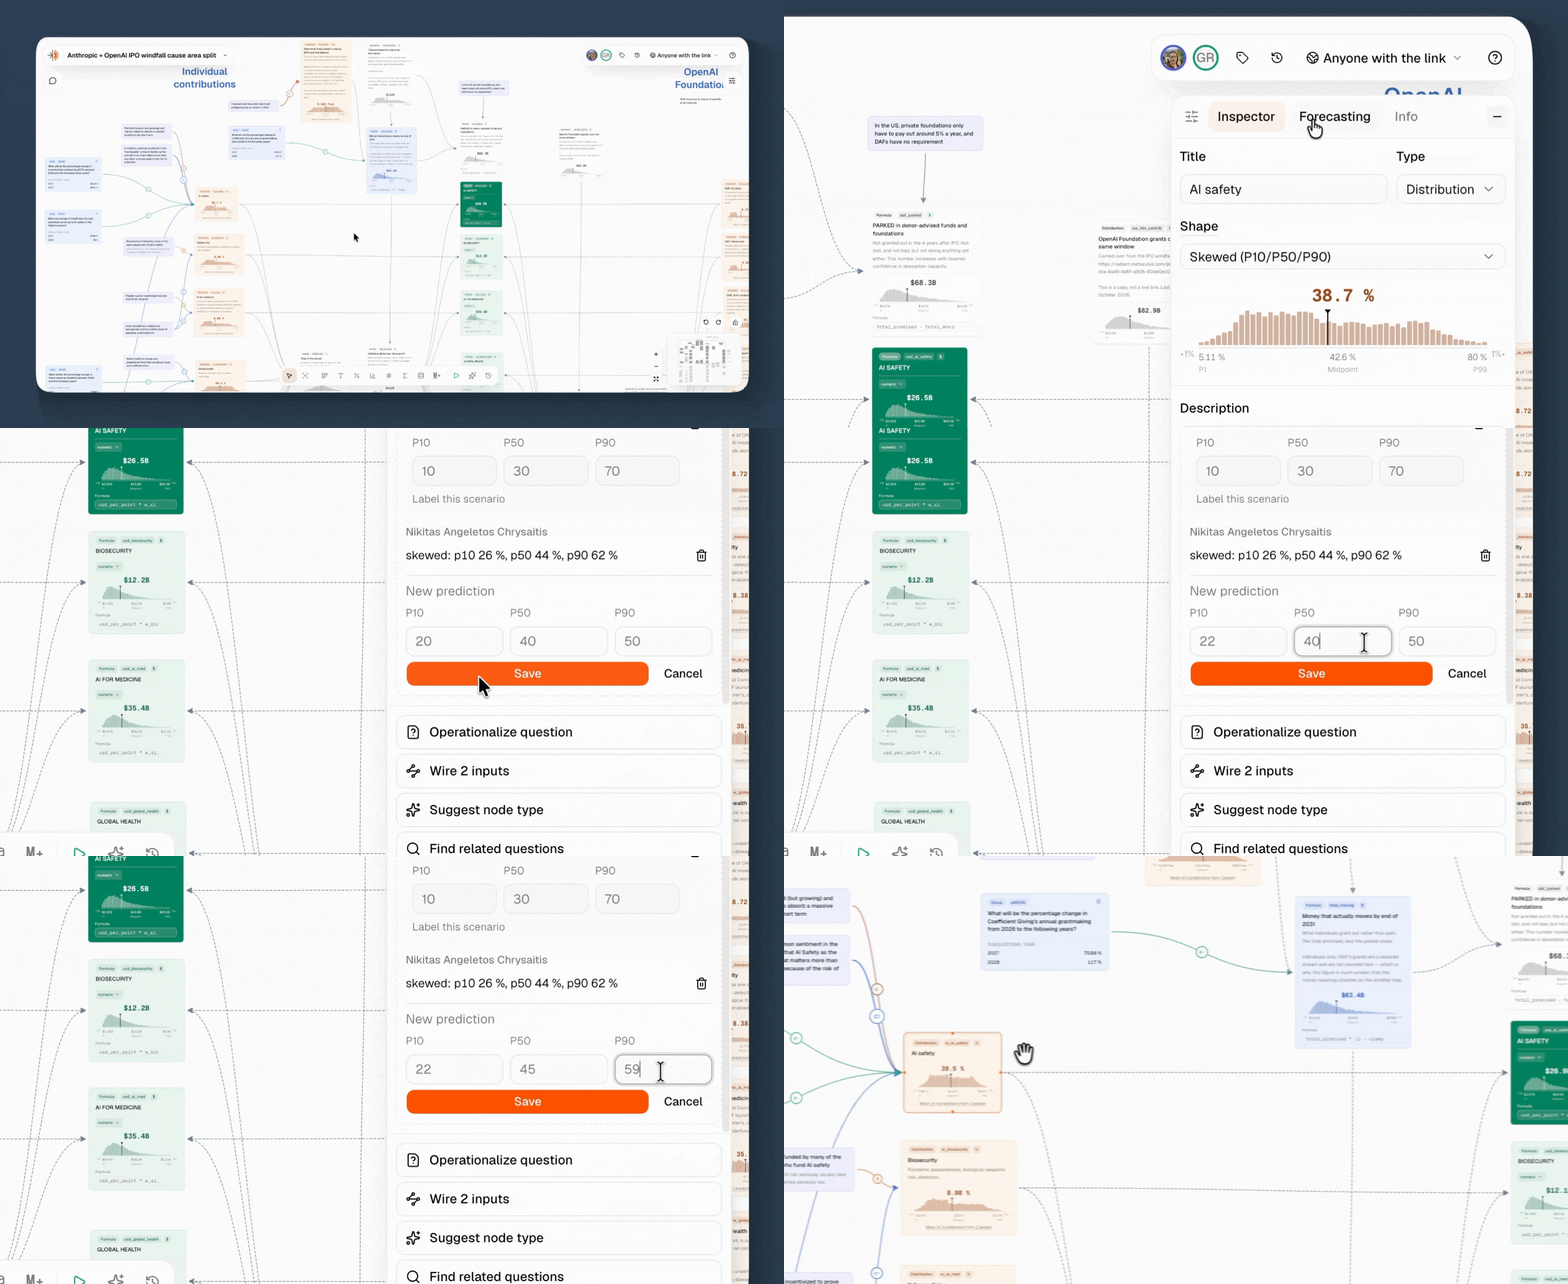
Fork the map to build your own version (you’ll need a Radiant account; sign up [here](https://radiant.metaculus.com/)). In your fork, you can restructure the whole map, start from different assumptions, or put in your own percentages for each cause area and watch how the dollar totals shift. If you need a refresher on adding forecasts to the orange nodes, [this notebook](https://metaculus.substack.com/p/radiant-map-the-predictions-ai-forecasting) walks you through it. You can also ask Radiant’s AI assistant to help you understand a map or help you build it.
You don’t have to forecast at all, either. If you’d rather show where you think the money *should* go, set the cause-area split to your preferred distribution.
Then share your map. Drop a link in the comments and tell us where you landed and why.
(Changes in your fork stay in your version and won’t move the numbers on ours. The team’s individual forecasts also don’t carry over to your copy.)
## **What's next**
The first two maps ask "How much?" and "Where to?" But there are plenty of other critical questions to explore — questions like “If a major AI incident happens right after the IPOs, how much more flows to AI safety?” or “Can AI Safety as a field actually absorb this much funding while retaining impact?” or “If global health receives the amount forecasted, how many lives could be saved?”
Some of those questions will be answered by other people’s maps. People working in this space and our Pro Forecasters are building their own, and we're curious to see where other models disagree with ours.
If you’re at a foundation or nonprofit, you can use this as a scenario to plan against, and change the inputs to stress-test it. [<u>Reach out to us</u>](mailto:grace.mclain@metaculus.com) if you would like help to use Radiant for a strategic planning workshop.
Add your[ <u>**forecasts to the AI Lab IPOs series**</u>](https://www.metaculus.com/tournament/ai-lab-ipo/) to improve the community predictions behind both maps.
[<u>**Start exploring or building off of the cause-area map**</u>](https://radiant.metaculus.com/projects/e80a5e79-b71f-4c4b-bf4a-821497fedcee)