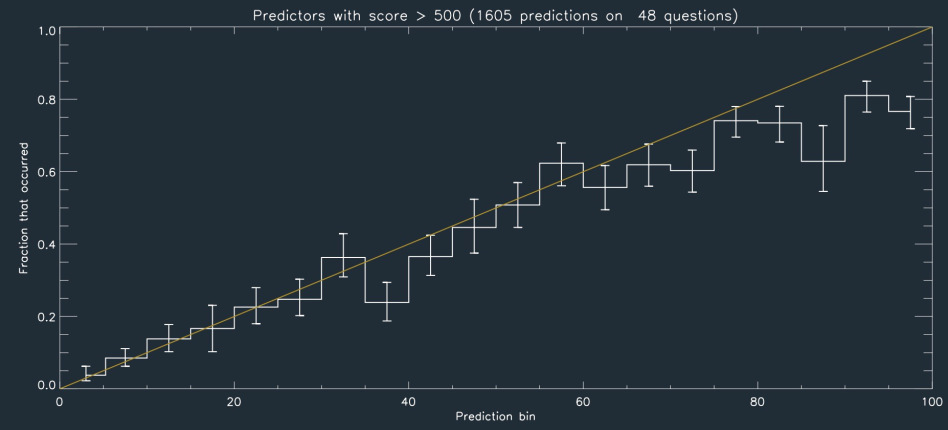
Metaculus users passed 20,000 predictions recently, and it seems time for a bit of analysis. Though there are predictions on about 300 questions total, this will concern the first 48 questions to resolve.

The figure above shows the ‘calibration plot’ for those 48 questions, based on the better predictors. This divvies up all of the predictions into bins of 1-5% likely, 5-10% likely, etc. For each ‘bin’, we plot what fraction of those predictions correspond to questions for which the answer was “yes.” What you’d really like is for all predictions to be either “0% probable” or “100% probable”, and that all of the 0% ones turn out not to happen, and all the 100% ones do happen. But that would require a time machine. Given our imperfect view of the future, we can at least hope that of the issues that are, say, 20% probable, 20% of them actually come true. If so, those percentages are actually meaningful, and can be used to make quantitative decisions.
As seen in the plot, Metaculus users do quite a good job at making well-calibrated predictions, especially for low probabilities. At the high-end, users tend to over-predict the probability of questions resolving positively. It’s interesting to consider why. This effect has been seen in other prediction experiments, and is often called “overconfidence.” But because predictions are also very confident at the low-probability end, but much better calibrated, it’s not clear that is the right way to think of it. Another possibility is that this may be a manifestation of Murphy’s law: when something is likely to happen, it is easy to fail to see all of the things that can go wrong in its happening. That is, there are many possible lowish-probability routes toward failure, and it is hard to take them all into account. For low-probability events, on the other hand, they are often low probability because there is a particular way (or a few ways) in which they occur. That is: many ‘failure modes’ for apparently-likely events, few ‘success modes’ for unlikely ones. So this is evidence that in predicting a ‘sure thing’, you are very likely missing a lot of ways it could go wrong! Another contributing factor may be that since Metaculus questions are posed with enough detail to make their resolution unambiguous, often several things must be true for the question to resolve positively. While requiring multiple occurrences should tend to make probabilities, small, the precision with which the criteria are stated may make the scenario seem more likely; this is known as the conjunction fallacy.
A few other tentative conclusions so far: - It is very difficult for any individual predictor to out-perform the aggregate of all the others. Only a small fraction of predictors have an average Brier score lower than that of the community’s aggregate prediction on the same set of questions. - Moreover, the current aggregate prediction is just a median over all predictions on each question. But the aggregation can be done better; experimentation with other aggregation schemes shows that with a better method almost nobody would be better than the community. - The aggregate predictions (by any aggregation method and including all predictors) are substantially more precise and well-calibrated than chance: depending upon aggregation method the mean Brier score is between 0.12 and 0.18, versus 0.33 if one were to randomly guess probabilities between 0 and 100%; (that case would also correspond to a horizontal line on the plot.)