Enriched Question Group Tiles in Your Feed
11
Enhanced question group timelines have been added to your feed, providing you with more context and more colors for a richer scrolling experience. Now you can see the top three highest probability subquestions within a group at a glance. Let us know what you think! 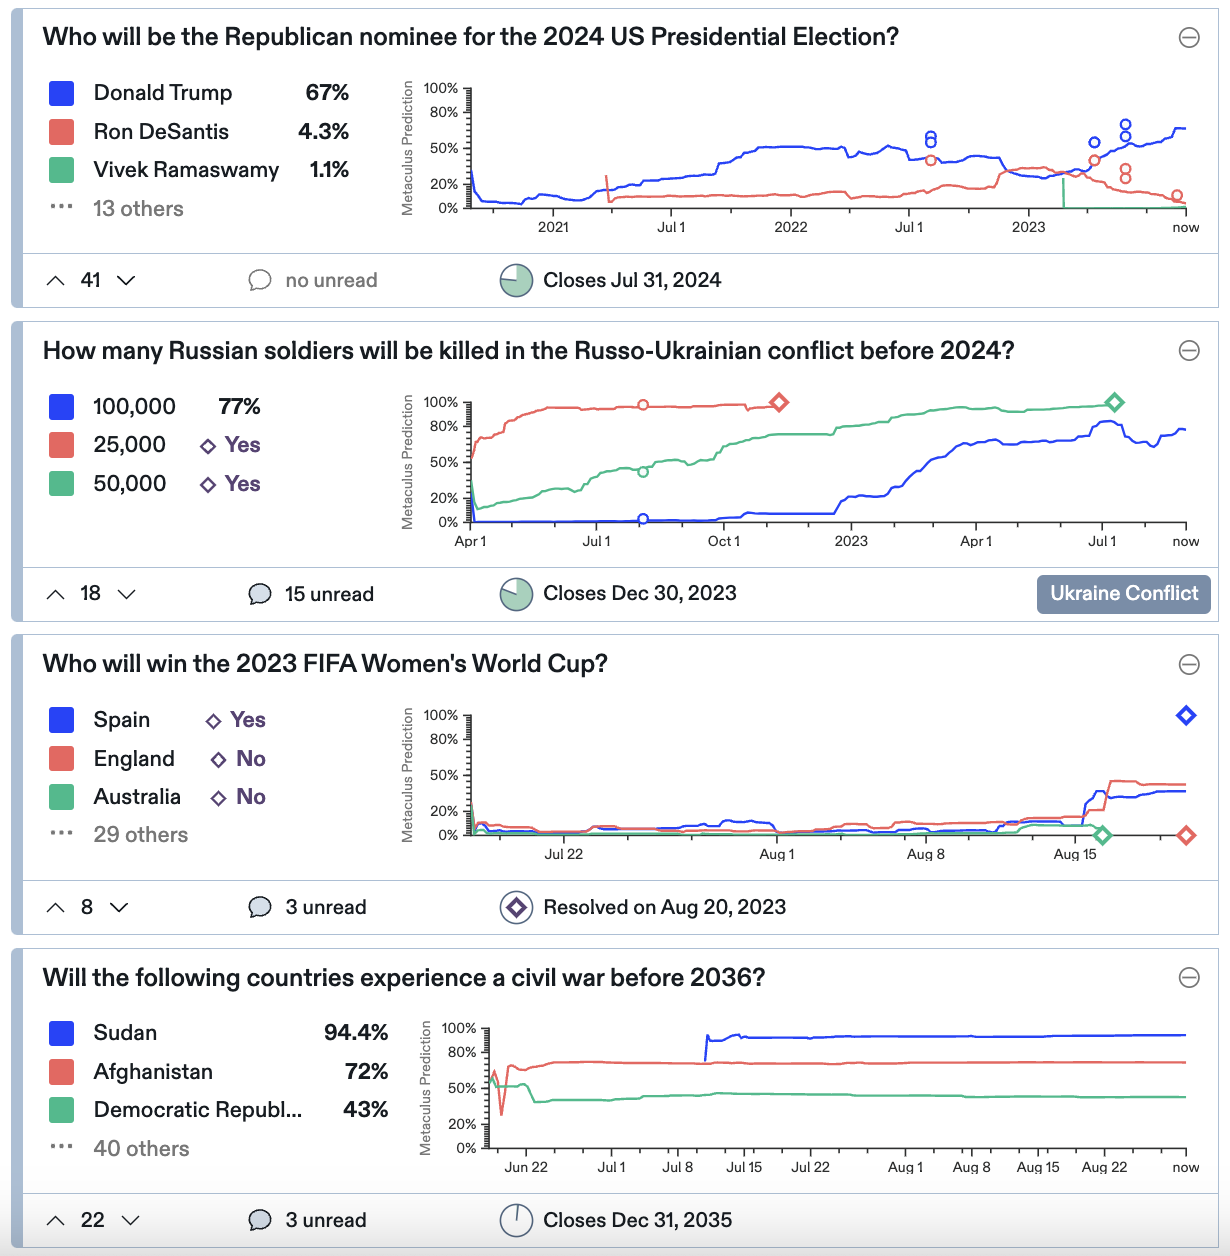 ### Introducing Enriched Question Group Timelines [August 15] Easily compare question group forecasts and quickly catch up on forecast timelines with our newly enriched question group graphs. 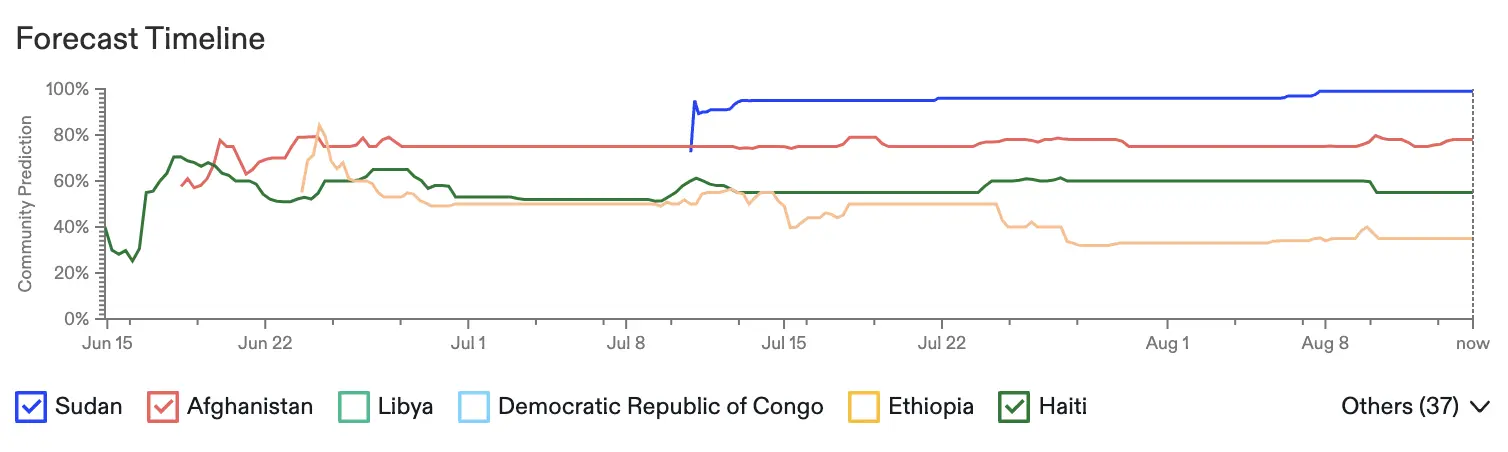 Previously, timelines displayed one subquestion forecast at a time. Now you can view up to six subquestion timelines at once and can enjoy greater control over what you see. Select the checkboxes of the forecast timelines you want to add to the graph. If there are more than six subquestions, the six with the highest probability will appear here. Click the dropdown menu to access the additional subquestions. 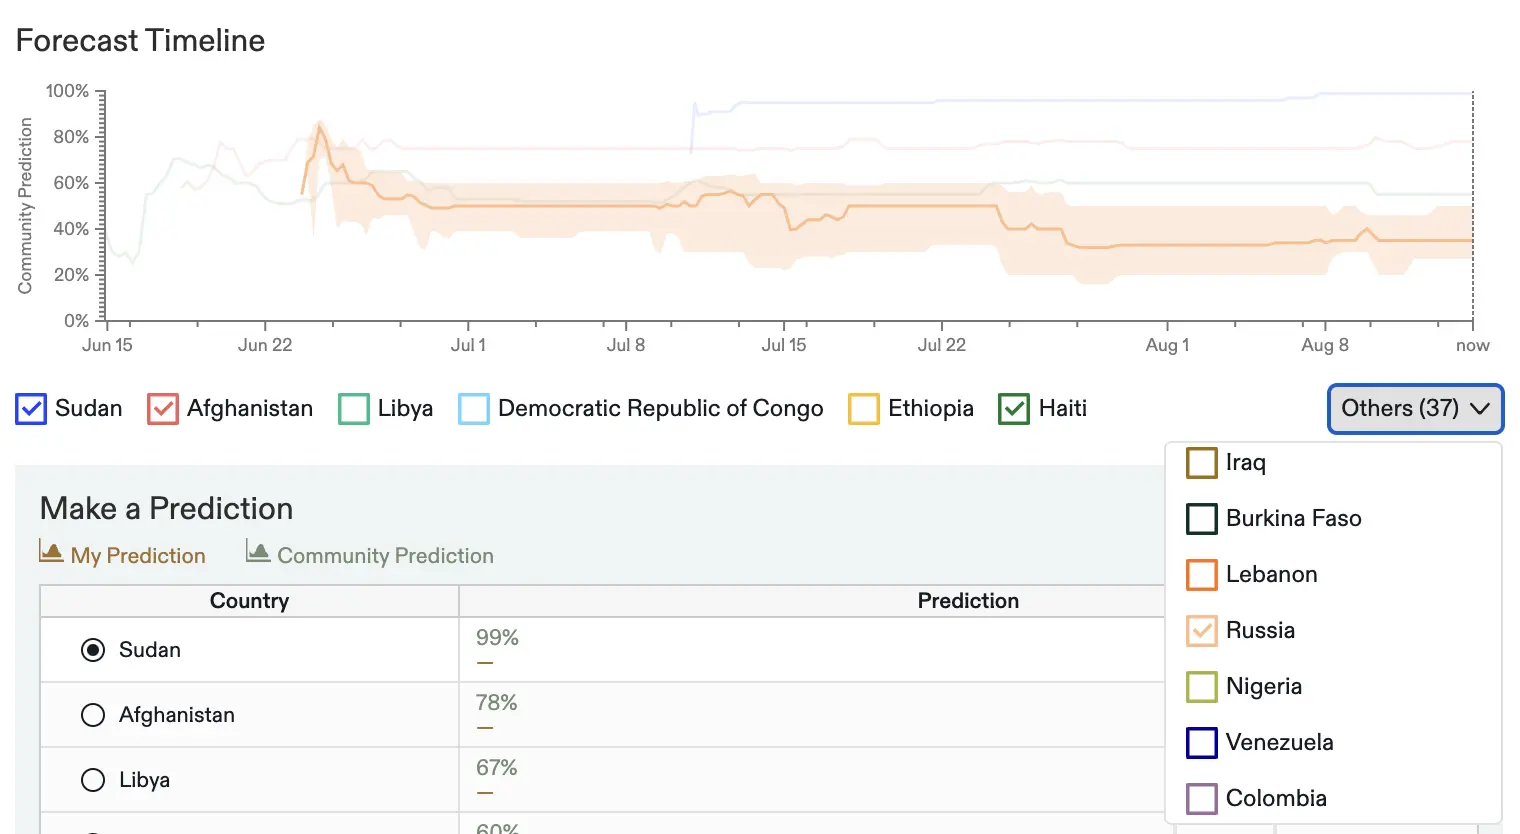 Hover over a subquestion to isolate it in the plot and display its [interquartile range](https://en.wikipedia.org/wiki/Interquartile_range). Want to see how many forecasters have predicted on a subquestion? Just deselect all checkboxes but one. Finally, you can also hover over points on the timeline graph to reveal the aggregate forecasts on that date. 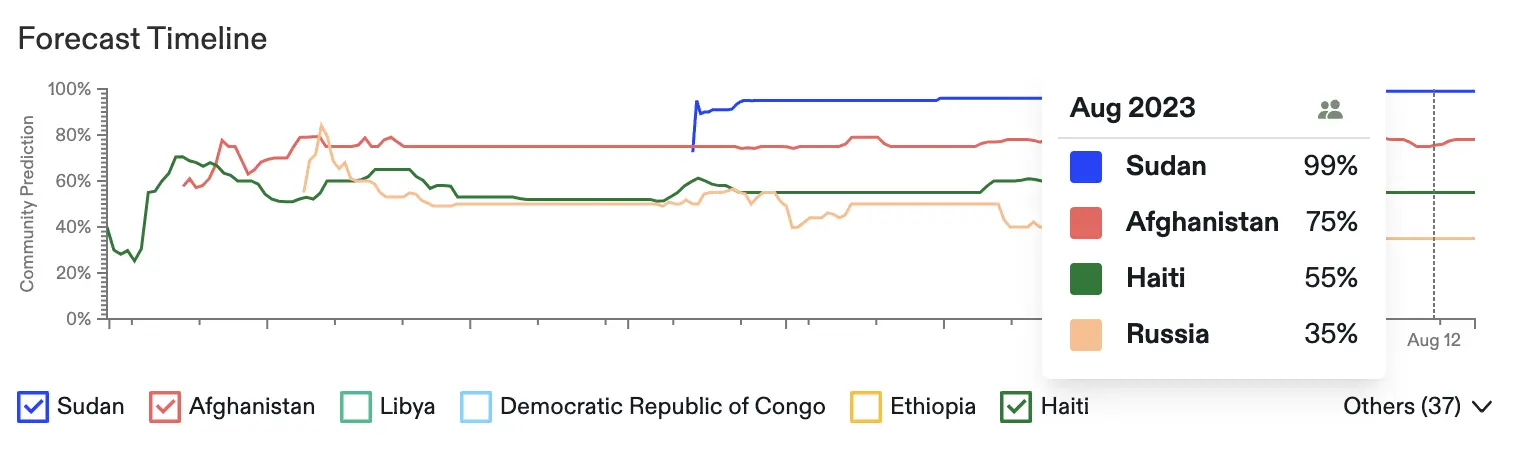 Ready to explore enriched question group graphs? Here are some to get you started: * [Which countries will see a civil war before 2036?](https://www.metaculus.com/questions/17299/civil-war-before-2035/) * [Who will be elected US President in 2024?](https://www.metaculus.com/questions/11245/winner-of-2024-us-presidential-election/) * [If Elon Musk and Mark Zuckerberg fight, who will win?](https://www.metaculus.com/questions/17703/musk-vs-elon-who-wins/) Looking for more? Just use the question feed’s filter to select ‘Group.’ We’d love to hear your thoughts and feedback in the comments!