
New: make continuous predictions with your keyboard!
14
We are introducing a new experimental feature: predicting continuous questions by writing down your distribution’s [quartiles](https://en.wikipedia.org/wiki/Quartile), aka your 25th percentile, median and 75th percentile. All continuous questions now have a *Slider* mode (what you’re used to) and a *Table* mode. In Table mode, the table below the graph becomes editable, and you can manually set your 3 quartiles as well as the probability you put out of each bound. <img src="https://metaculus-web-media.s3.amazonaws.com/user_uploaded/table_forecasting_BqR0dx4.gif" /> In table mode, your cdf is linearly interpolated between the 5 values in the table, which corresponds to a piecewise uniform pdf: | cdf | pdf | | :-------------------------------------------------------------------------------: | :-------------------------------------------------------------------------------: | | 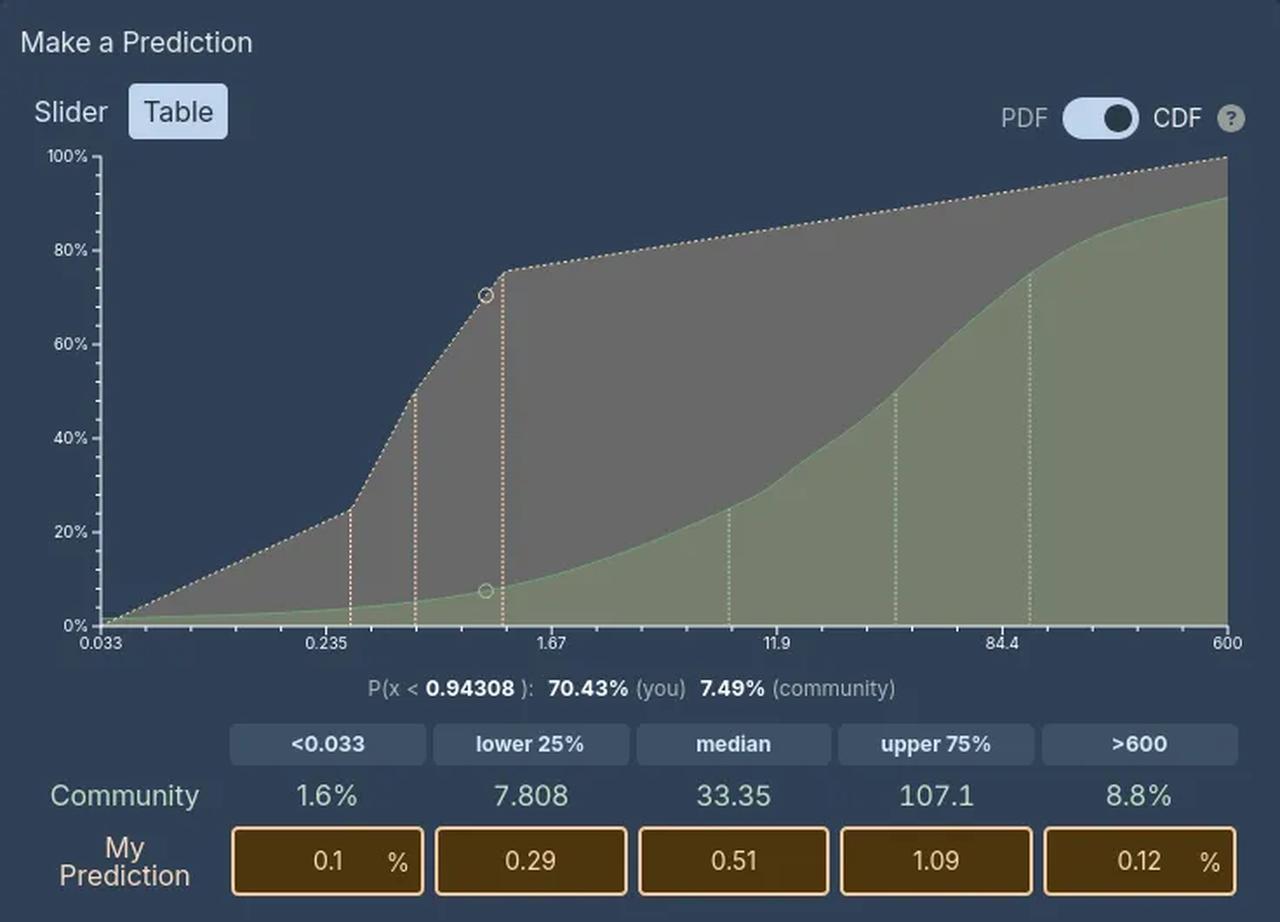 | 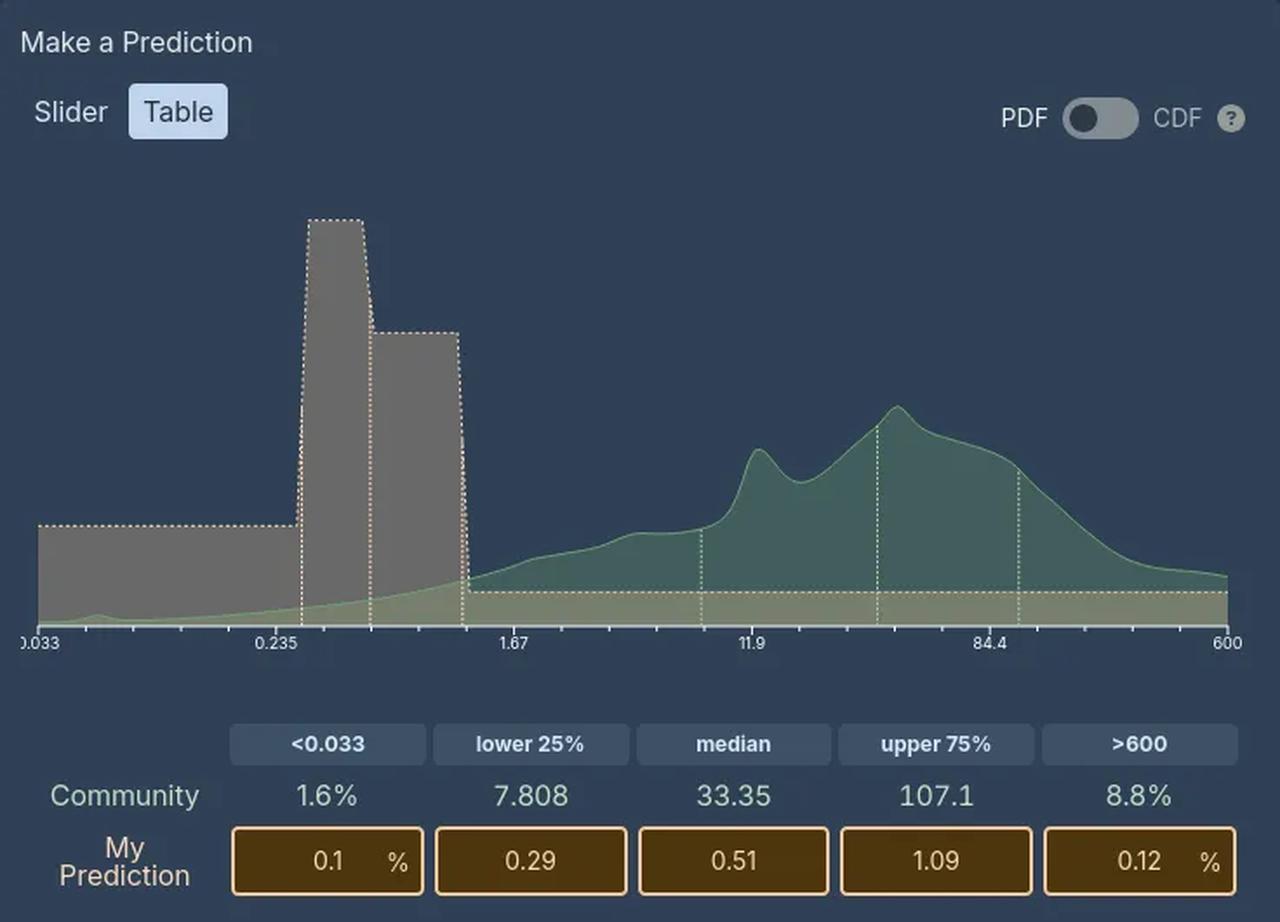 | We find that the table mode makes much more sense in cdf space, so that’s the default, but of course you can switch back to pdf using the toggle in the top-right. Switching from Sliders to Table preserves the values in the table exactly: 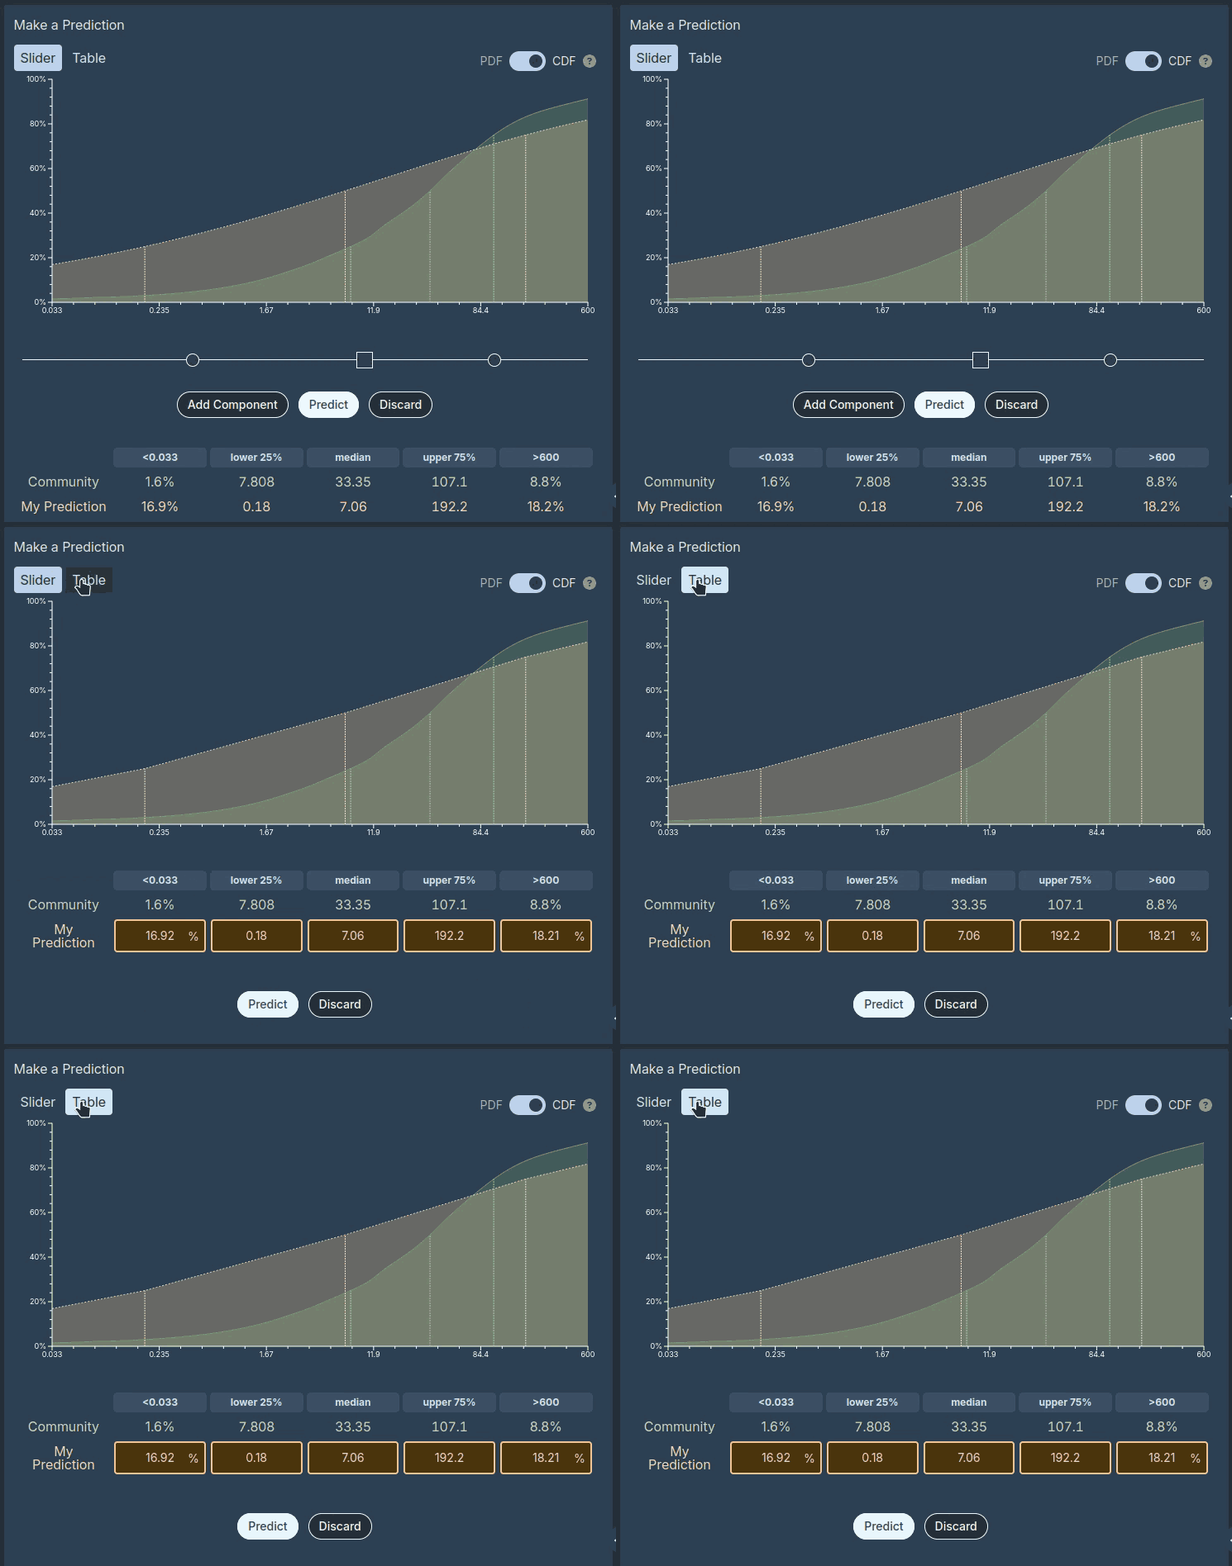 When switching from the table to the sliders, we do our best to fit a distribution to the values you chose. This often works well, but not always: | Good fit | Not so much | | :-----------------------------------------------------------------------------------------------: | :----------------------------------------------------------------------------------------------: | | 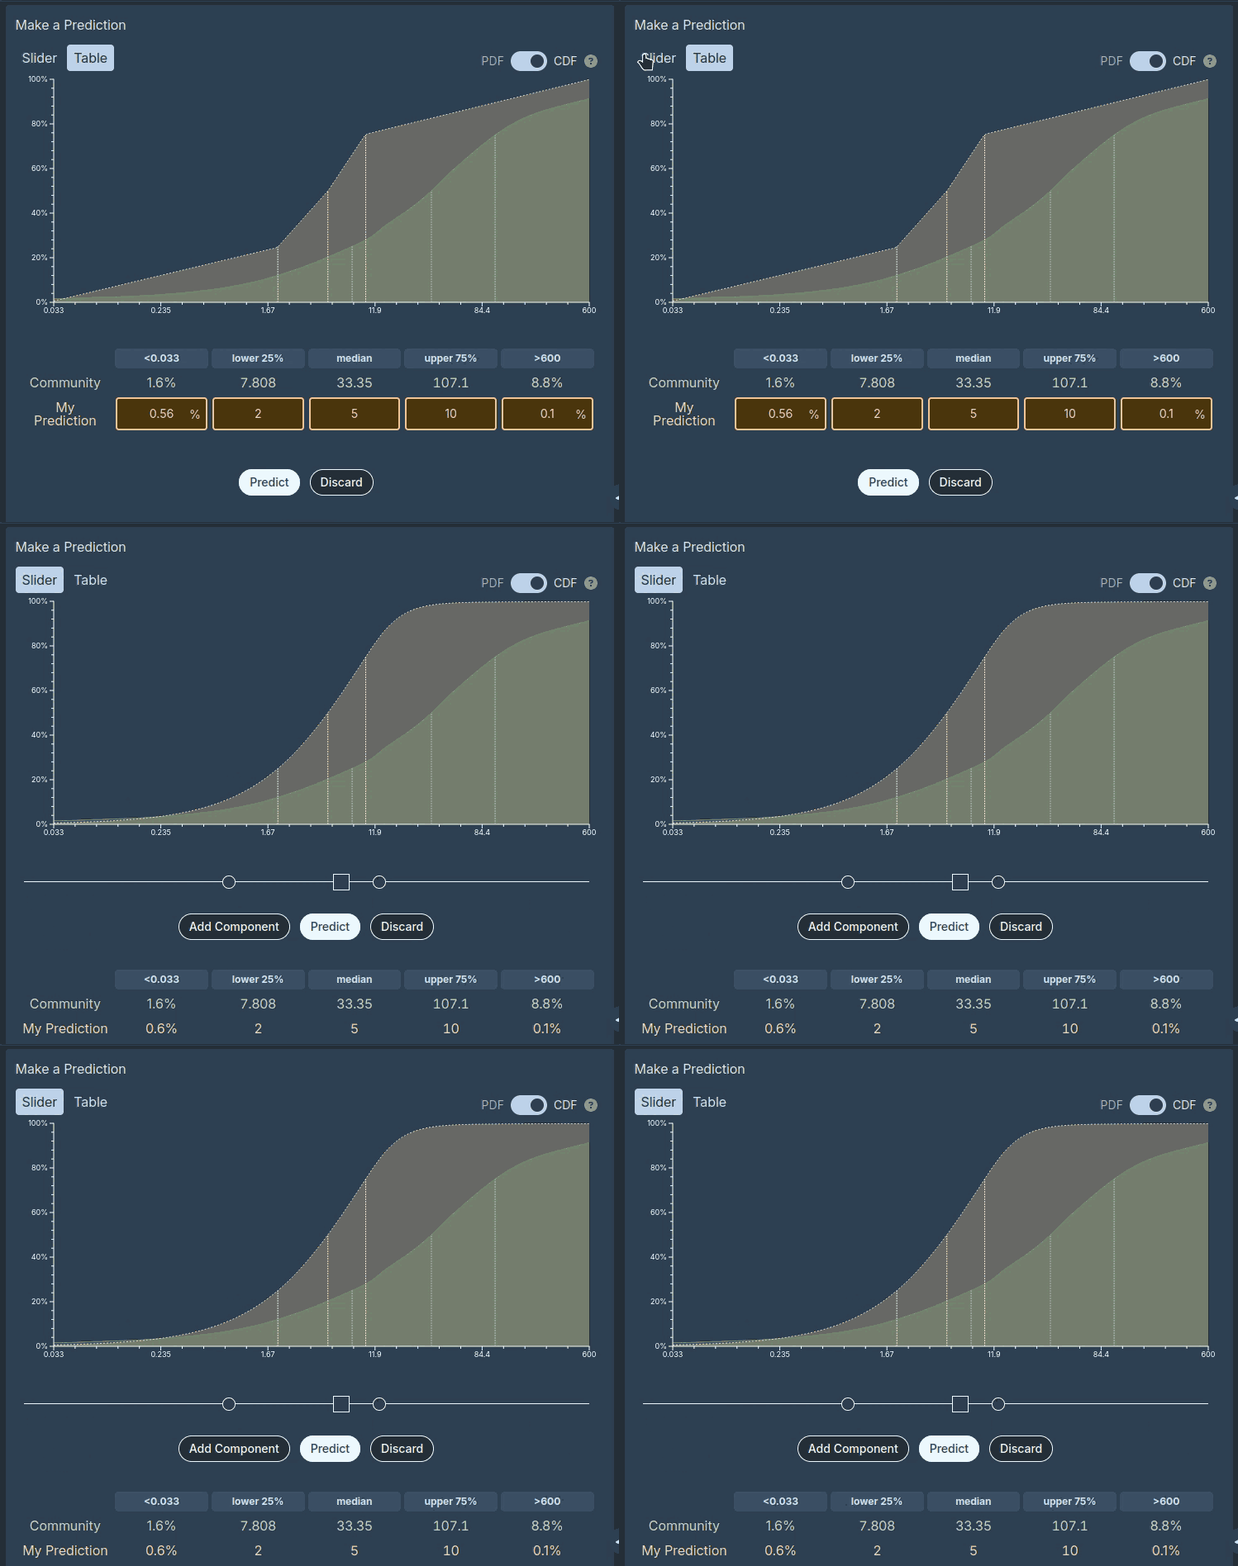 | 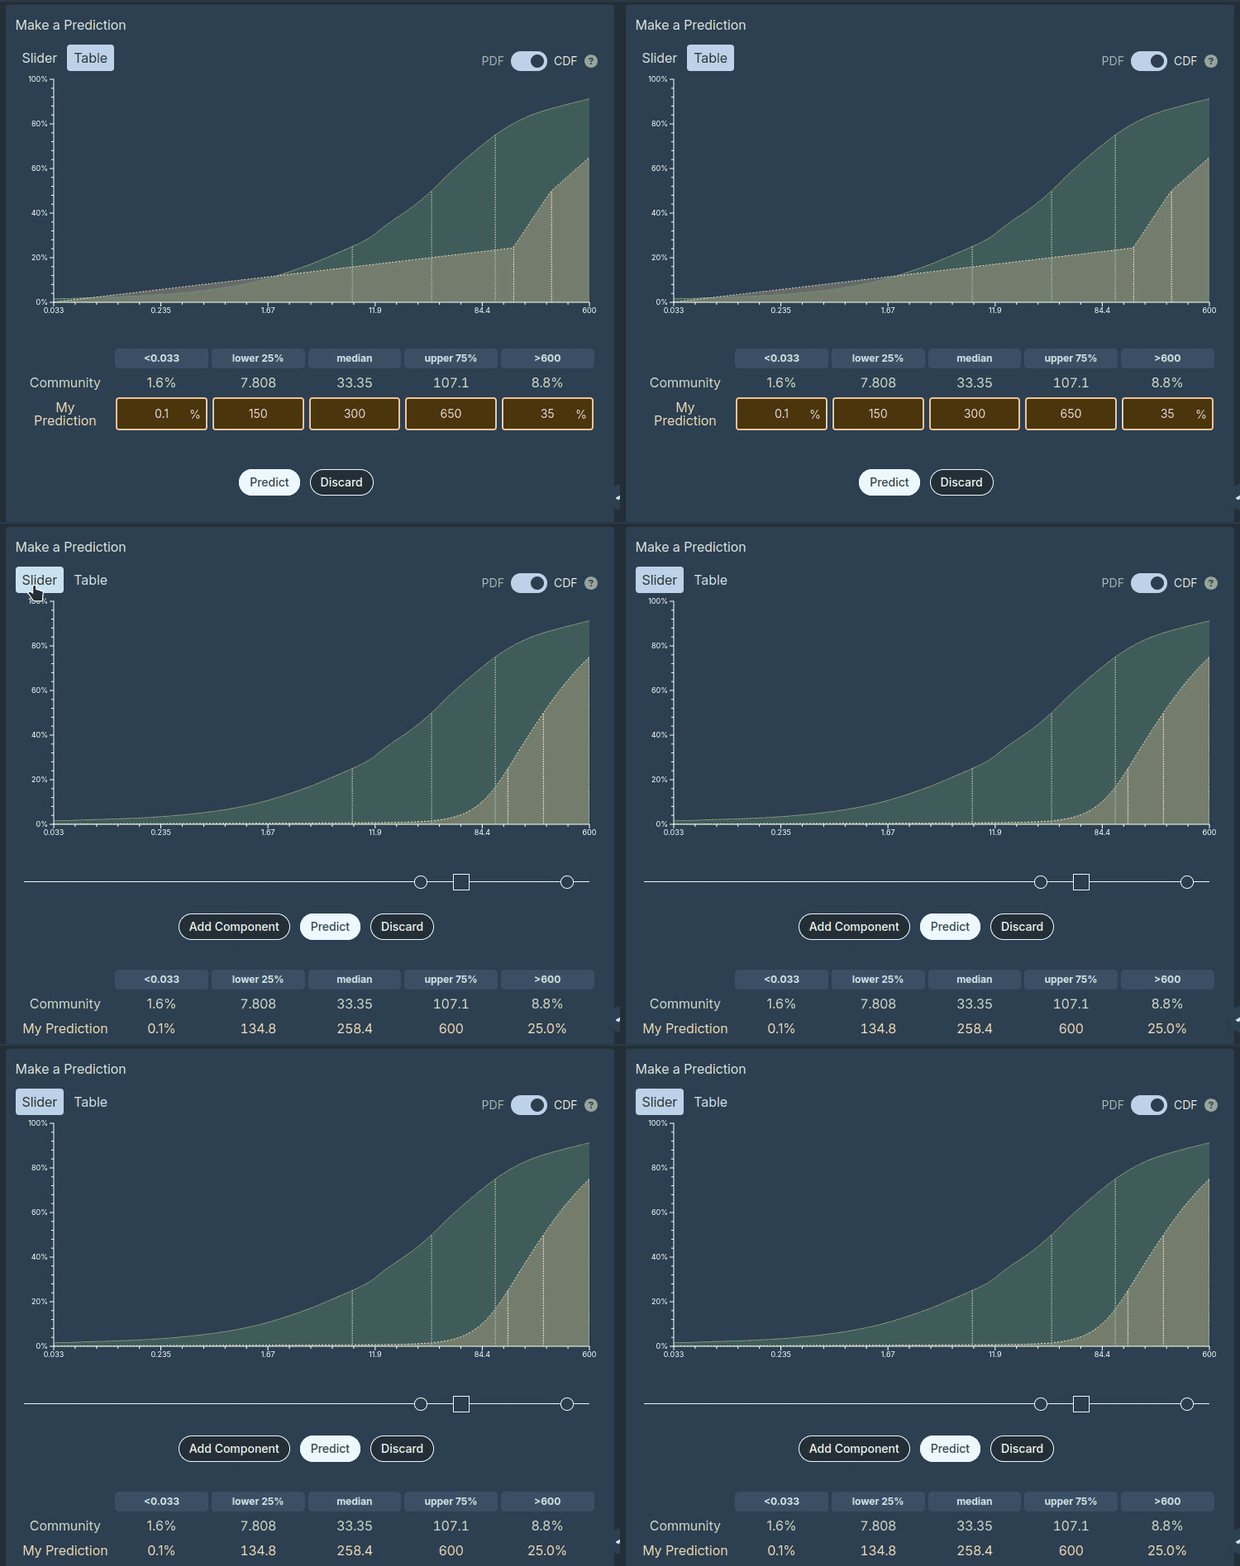 | The slider-fitting particularly struggles with multimodal distributions, and probability mass out of bounds. If you’re not satisfied with the result, use the discard button to revert to your last saved prediction. This is a very experimental feature! We look forward to your feedback and ideas for improvement. We already have some ideas of our own, including: adding more quantiles (every 5 percentage points?) ; letting you add more quantiles or remove some ; improving the slider fitting feature (possibly fitting 2 or 3 components) ; adding optional pdf smoothing to the table mode ; making the pdf/cdf graph interactive in table mode letting you drag your curve around ; … <br /> <br /> <br /> <hr /> P.S.: did you know that you can now follow our [news feed](https://www.metaculus.com/news/) and get notified of new posts directly in your inbox? <img width="500" alt="The Metaculus-news feed" src="https://metaculus-web-media.s3.amazonaws.com/user_uploaded/image_5UVWHZU.png" />